Tạo số liệu tùy chỉnh
CloudWatch metric cung cấp một số số liệu cho các hàm Lambda như số lần hàm được thực thi, thời gian thực thi mỗi lần, tỷ lệ lỗi và số lần bị giới hạn. Để xem các số liệu của một hàm nhất định, chúng ta thực hiện các bước sau.
-
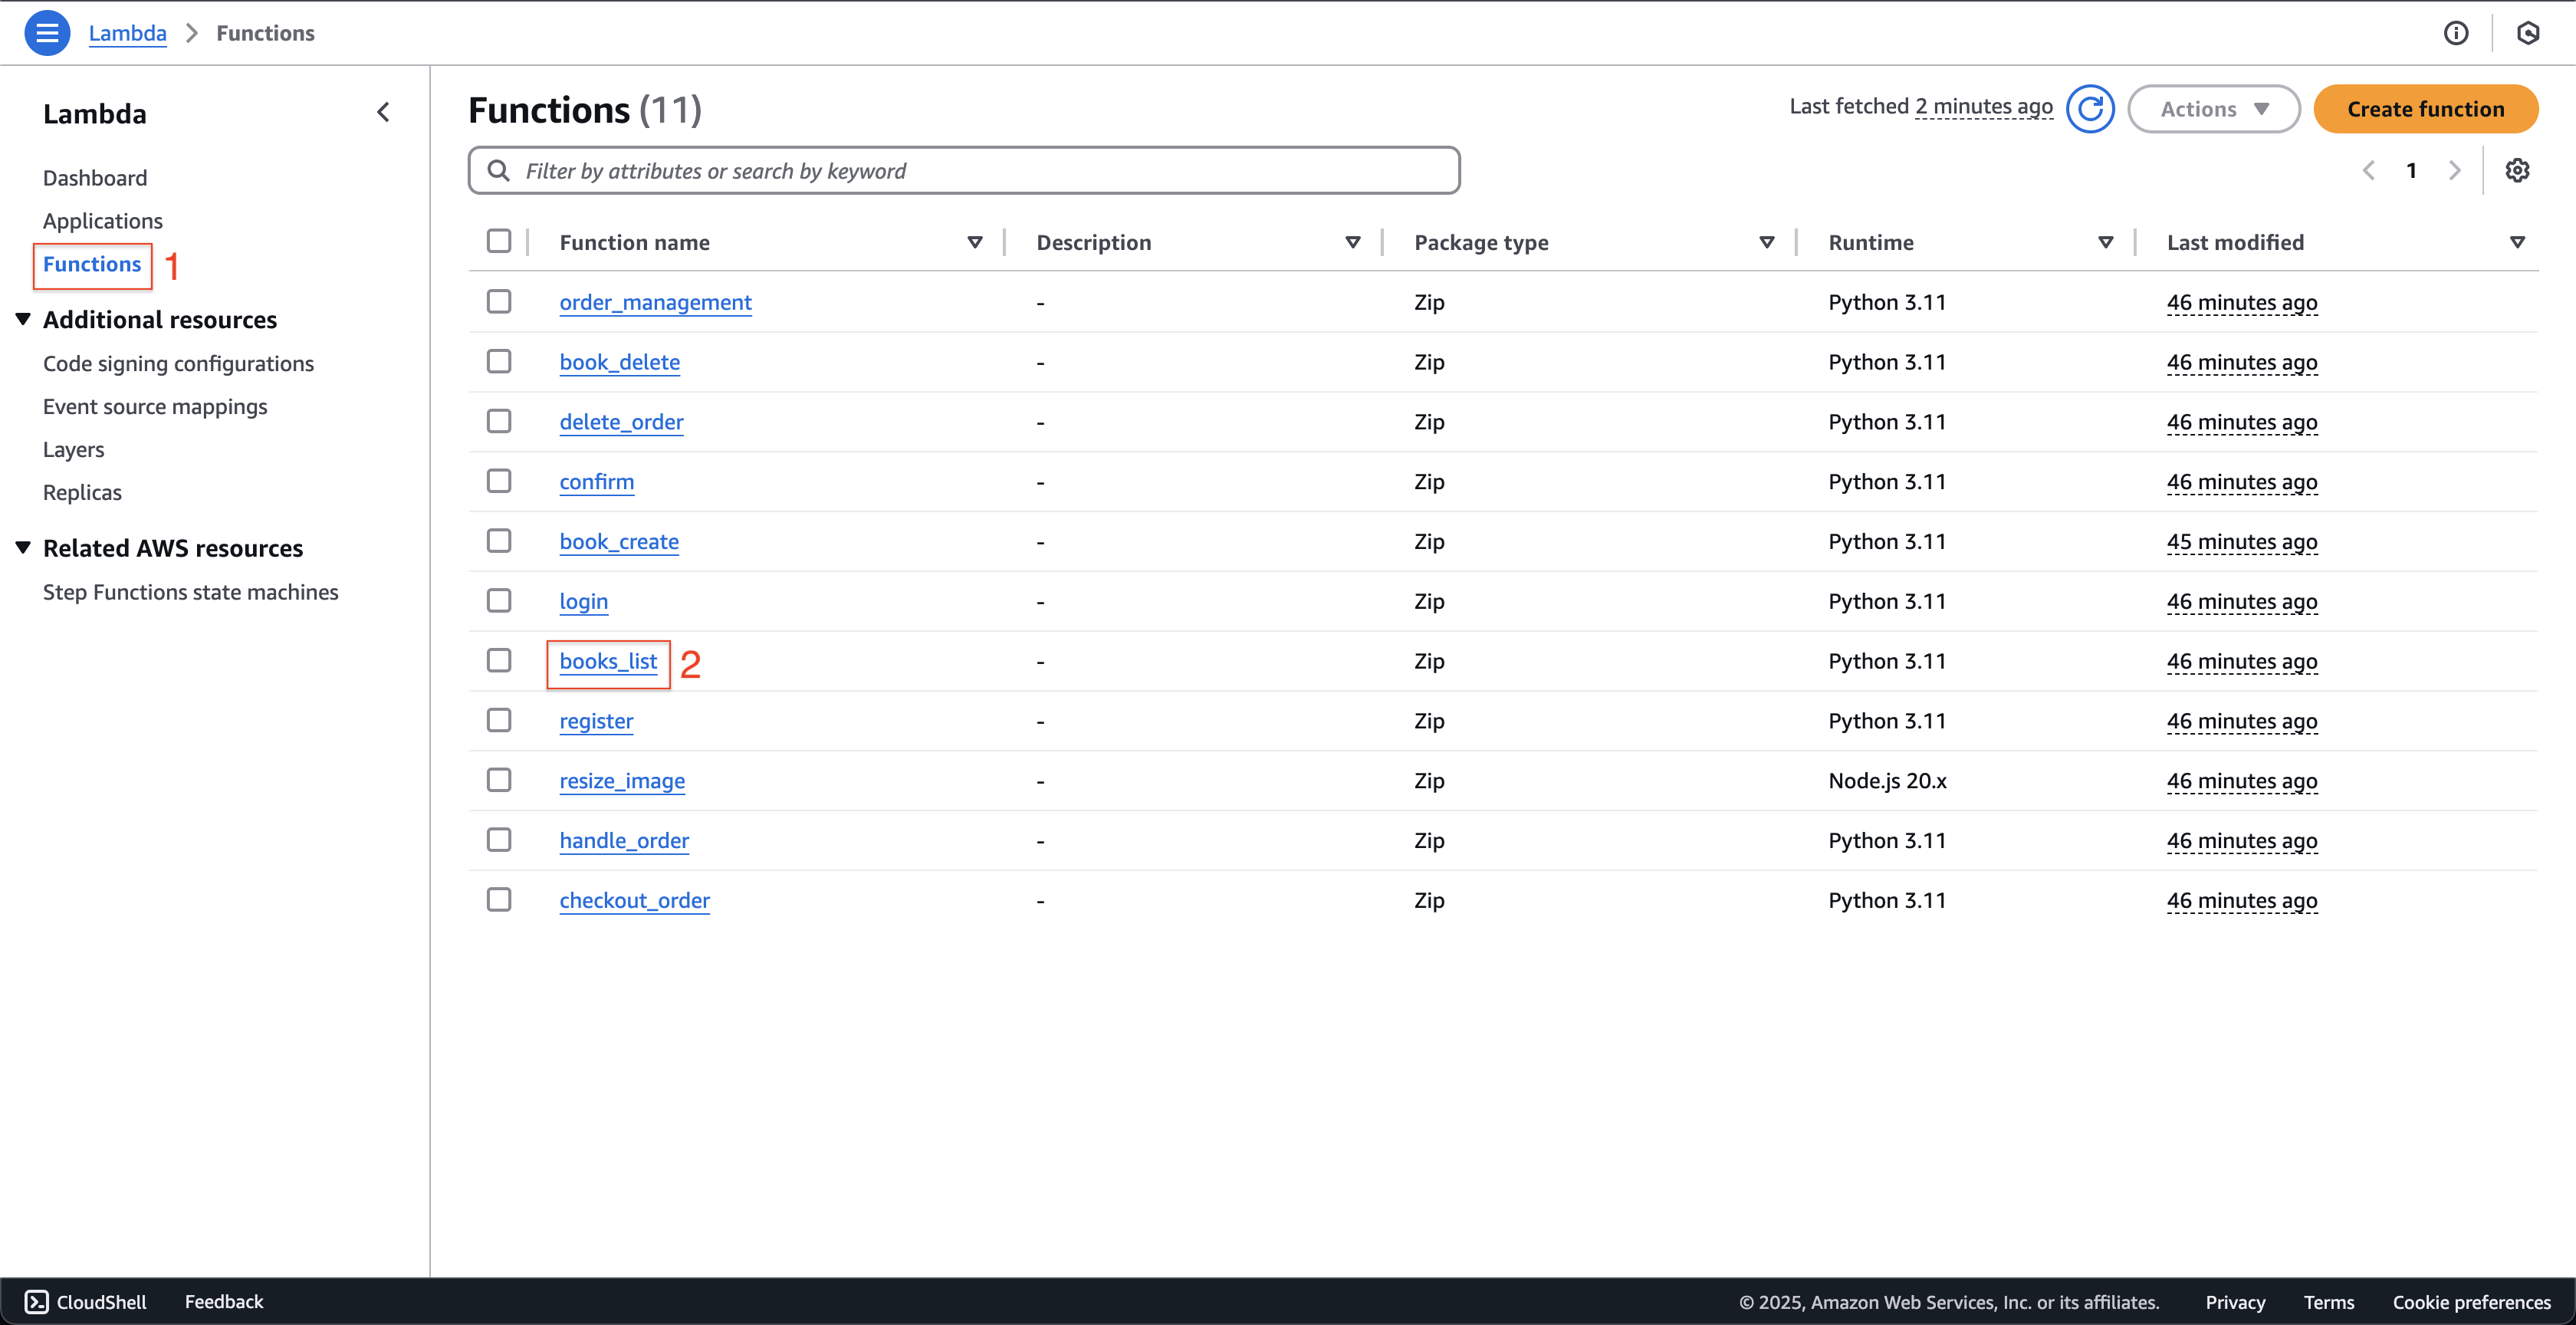
- Nhấn Functions trên menu bên trái.
- Chọn hàm books_list.
-
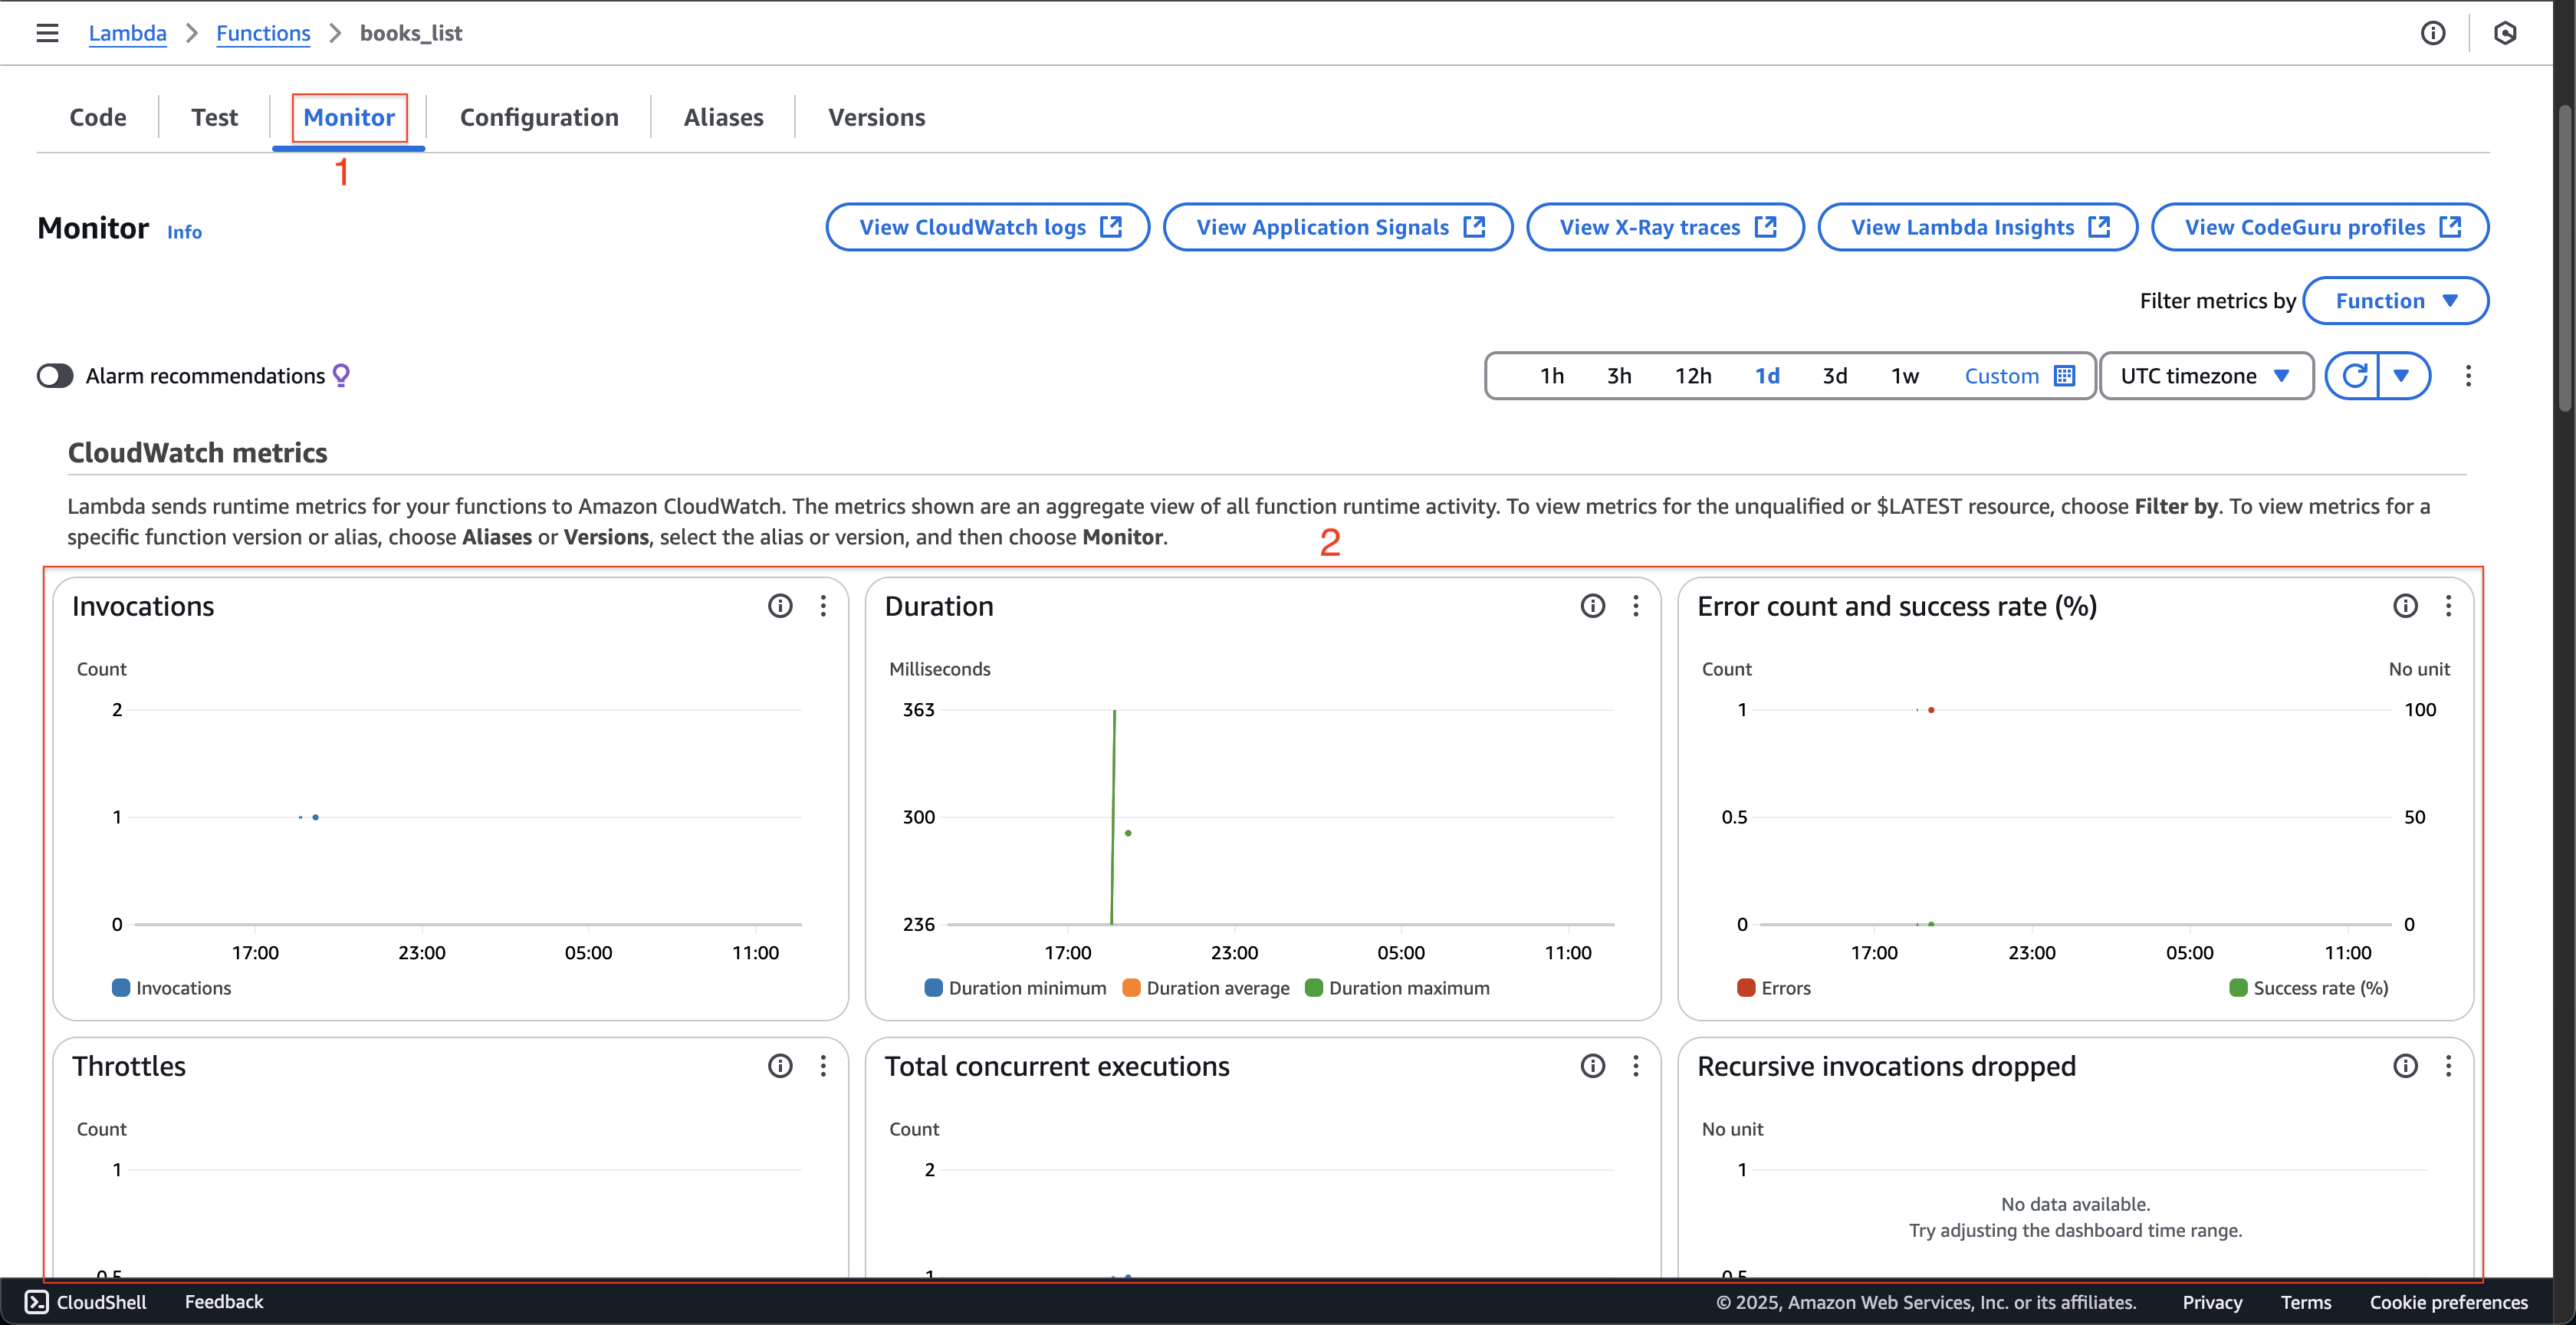
Tại trang books_list.
- Nhấn tab Monitor.
- Bạn có thể thấy các CloudWatch metrics được hiển thị.
-
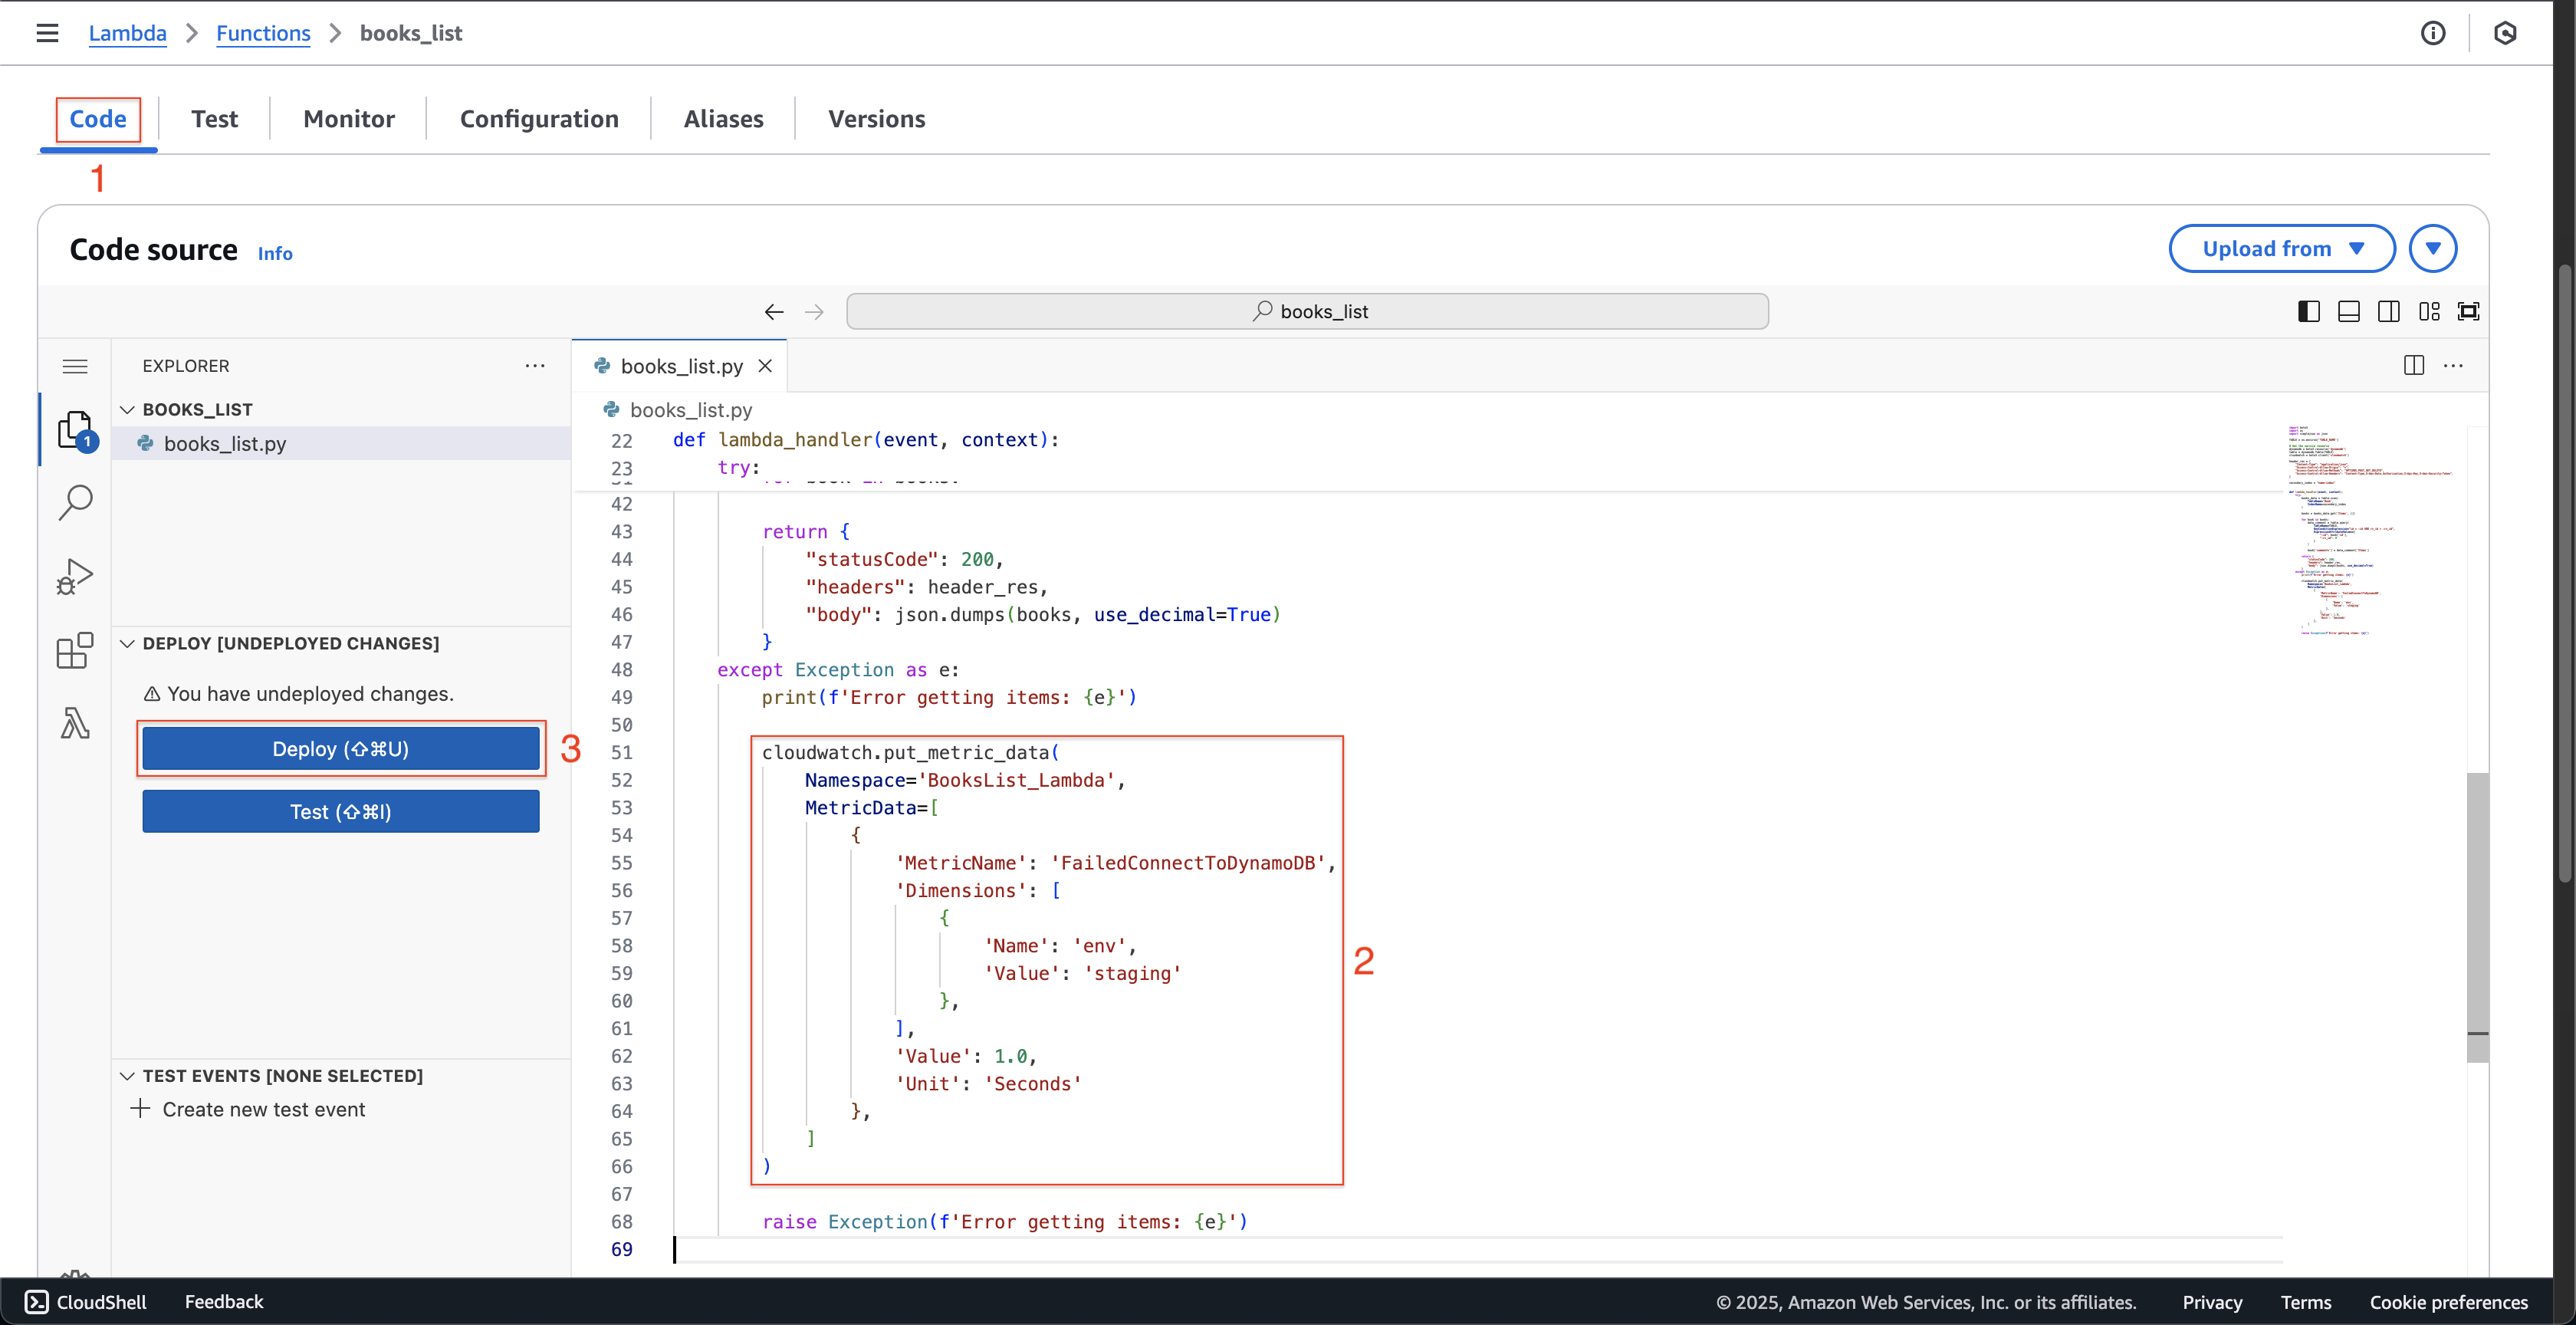
Tiếp theo, chúng ta sẽ tạo một số liệu tùy chỉnh mới để tổng hợp số lần truy cập vào DynamoDB bị lỗi. Tại trang books_list.
-
Nhấn tab Code.
-
Sao chép đoạn mã sau.
import boto3 import os import simplejson as json TABLE = os.environ['TABLE_NAME'] # Get the service resource dynamodb = boto3.resource('dynamodb') table = dynamodb.Table(TABLE) cloudwatch = boto3.client('cloudwatch') header_res = { "Content-Type": "application/json", "Access-Control-Allow-Origin": "*", "Access-Control-Allow-Methods": "OPTIONS,POST,GET,DELETE", "Access-Control-Allow-Headers": "Content-Type,X-Amz-Date,Authorization,X-Api-Key,X-Amz-Security-Token", } secondary_index = "name-index" def lambda_handler(event, context): try: books_data = table.scan( TableName='Book', IndexName=secondary_index ) books = books_data.get('Items', []) for book in books: data_comment = table.query( TableName=TABLE, KeyConditionExpression="id = :id AND rv_id > :rv_id", ExpressionAttributeValues={ ":id": book['id'], ":rv_id": 0 } ) book['comments'] = data_comment['Items'] return { "statusCode": 200, "headers": header_res, "body": json.dumps(books, use_decimal=True) } except Exception as e: print(f'Error getting items: {e}') cloudwatch.put_metric_data( Namespace='BooksList_Lambda', MetricData=[ { 'MetricName': 'FailedConnectToDynamoDB', 'Dimensions': [ { 'Name': 'env', 'Value': 'staging' }, ], 'Value': 1.0, 'Unit': 'Seconds' }, ] ) raise Exception(f'Error getting items: {e}') -
Nhấn nút Deploy.
-
-
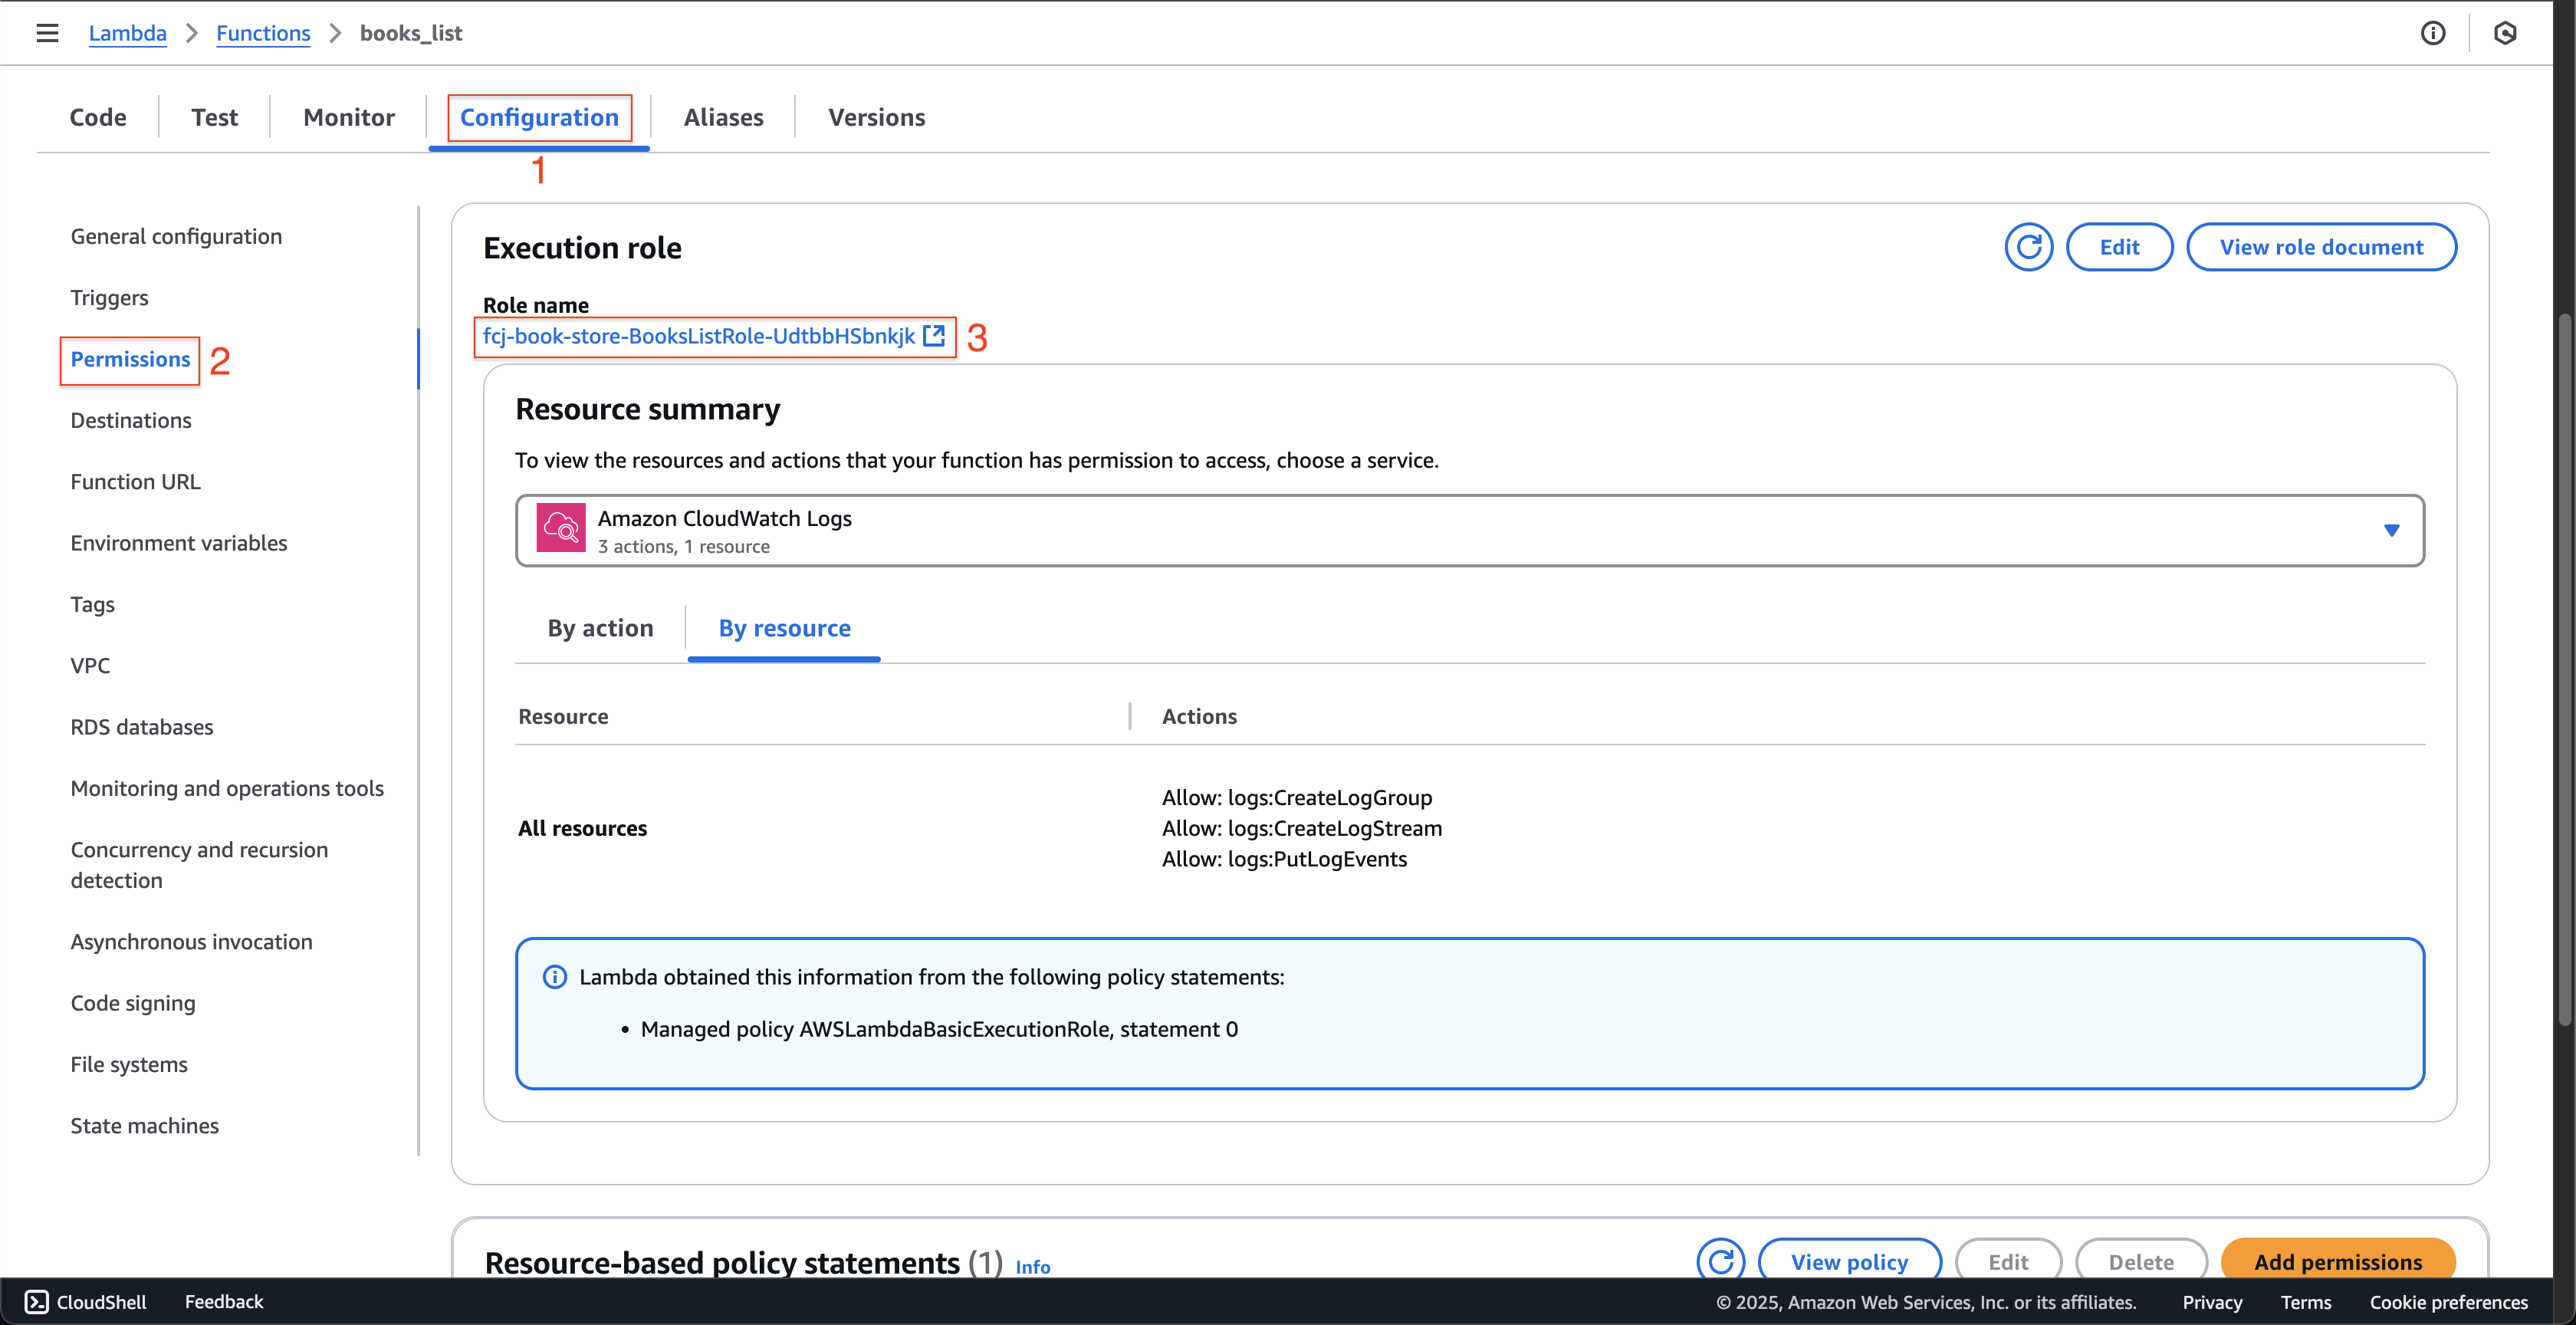
Tại trang books_list.
- Nhấn tab Configuration.
- Nhấn Permissions trên menu bên trái.
- Nhấn fcj-book-store-BooksListRole-… tại Role name.
-
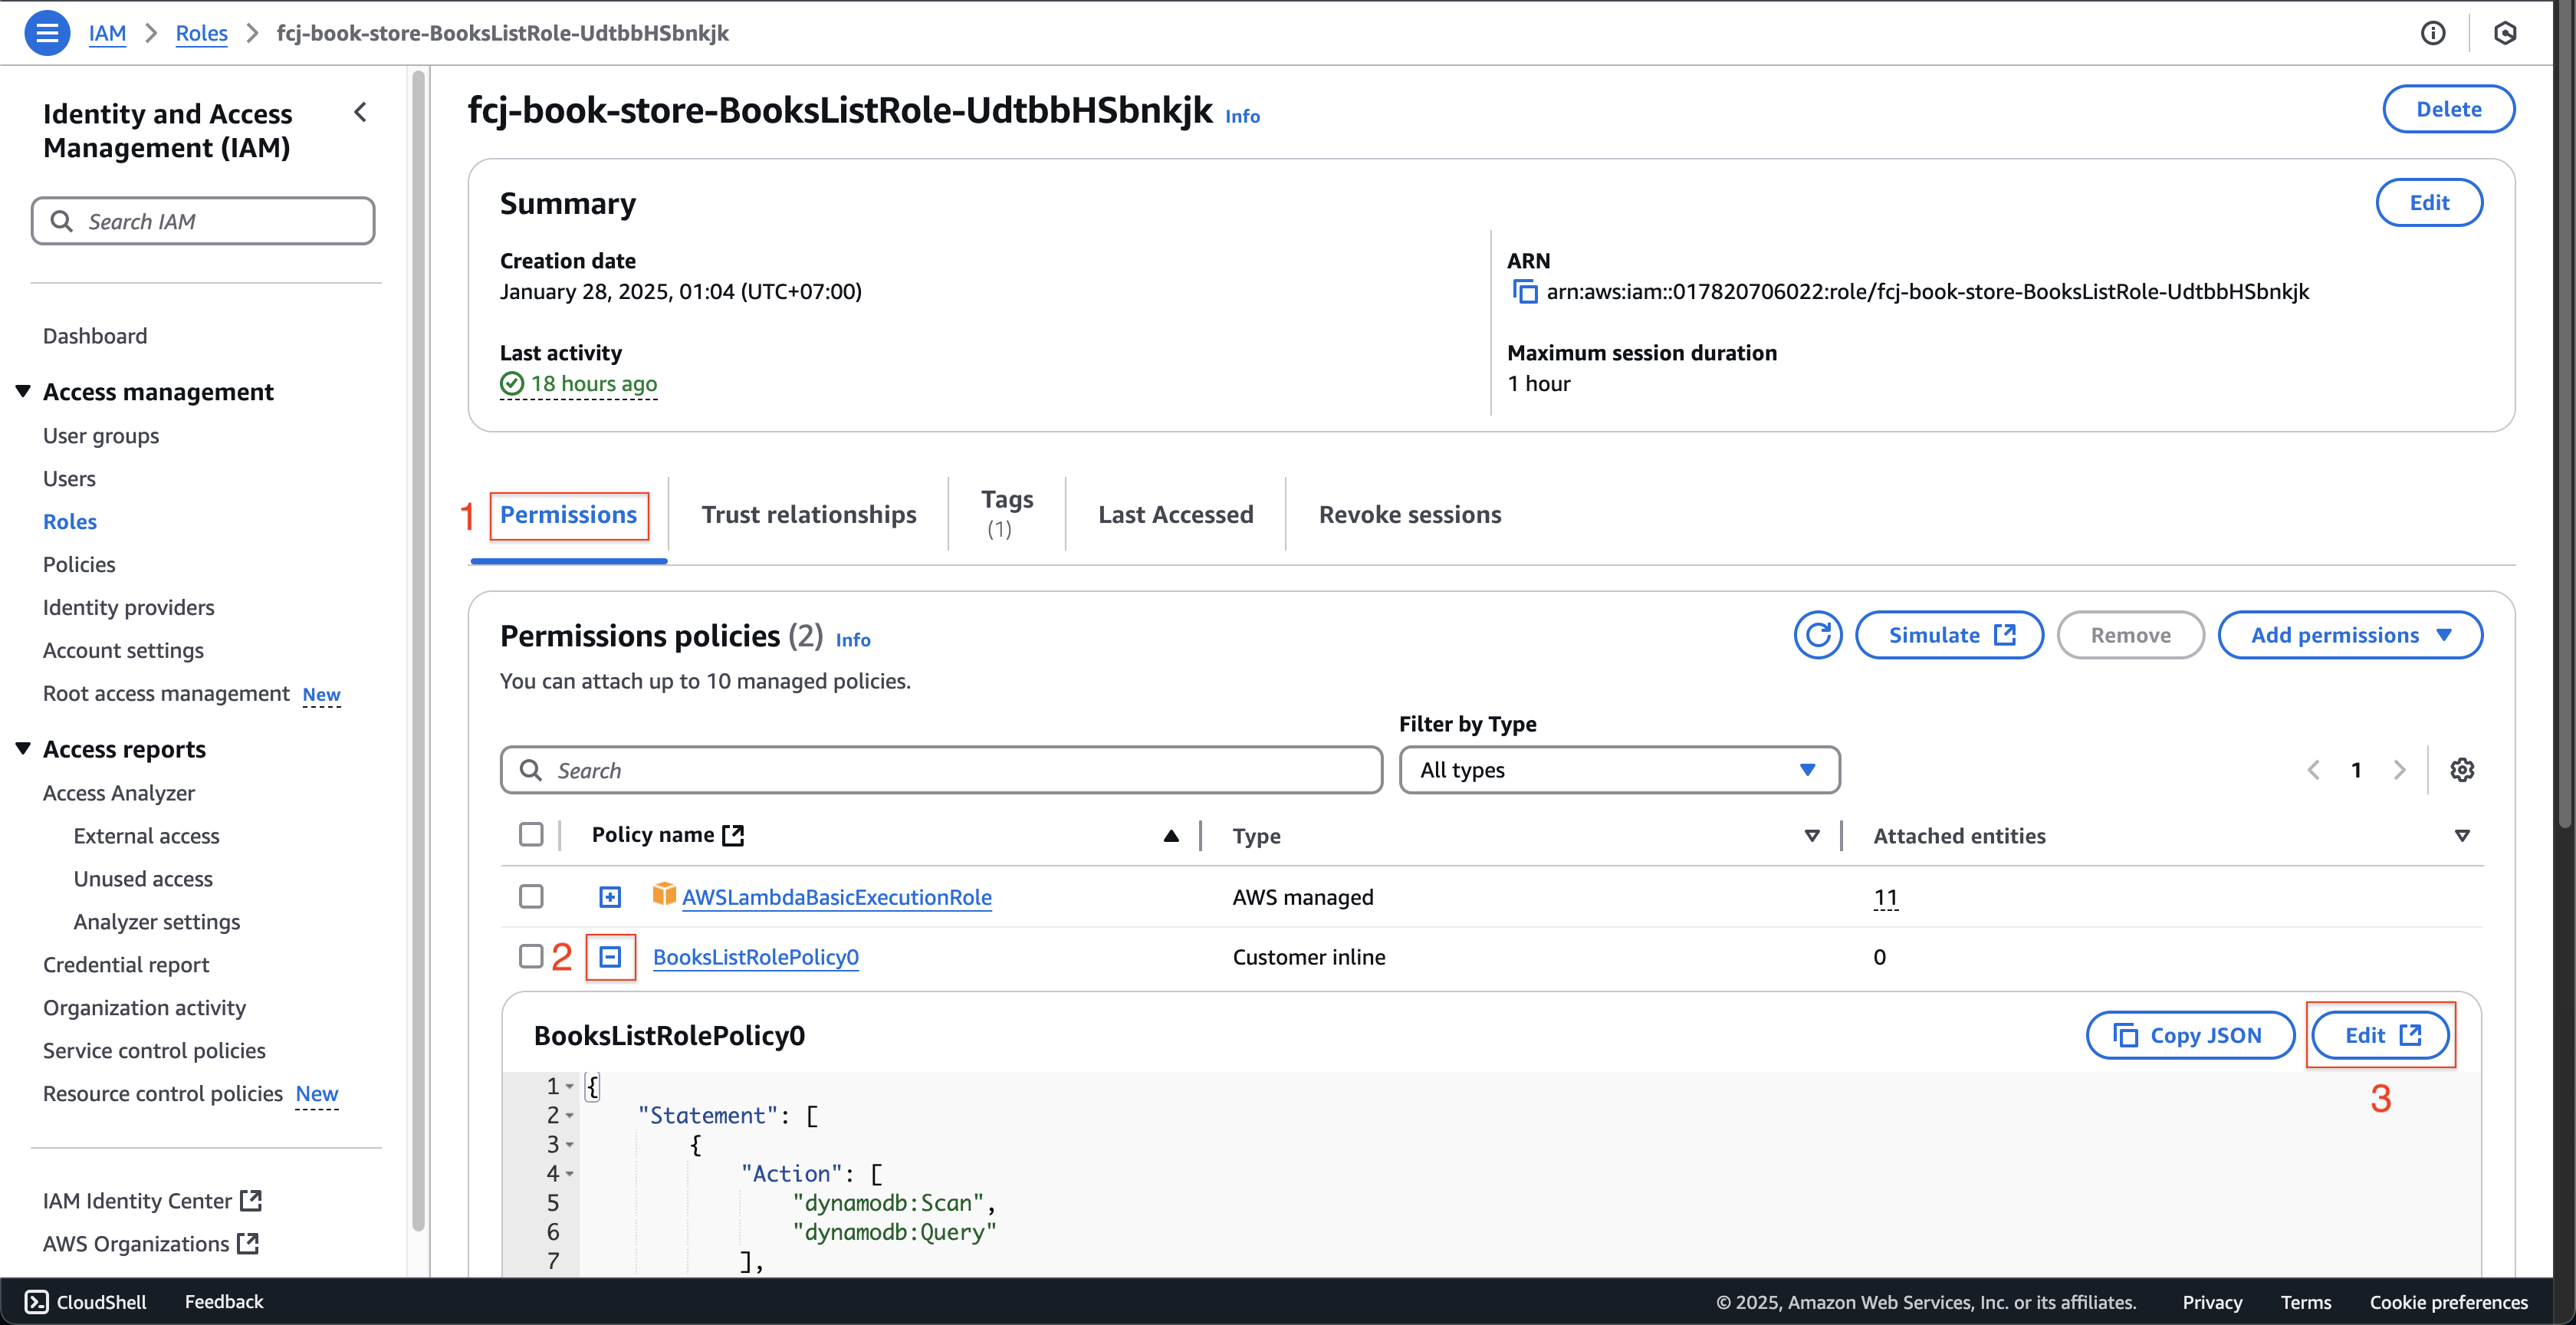
Tại trang fcj-book-store-BooksListRole-….
- Nhấn tab Permissions.
- Nhấn + tại BooksListRolePolicy0 Policy name.
- Nhấn nút Edit.
-
Tại trang Step 1: Modify permissions in BooksListRolePolicy0.
-
Nhấn tab JSON.
-
Sao chép đoạn mã sau vào Policy editor.
{
    "Sid": "VisualEditor0",
    "Effect": "Allow",
    "Action": "cloudwatch:PutMetricData",
    "Resource": "*"
},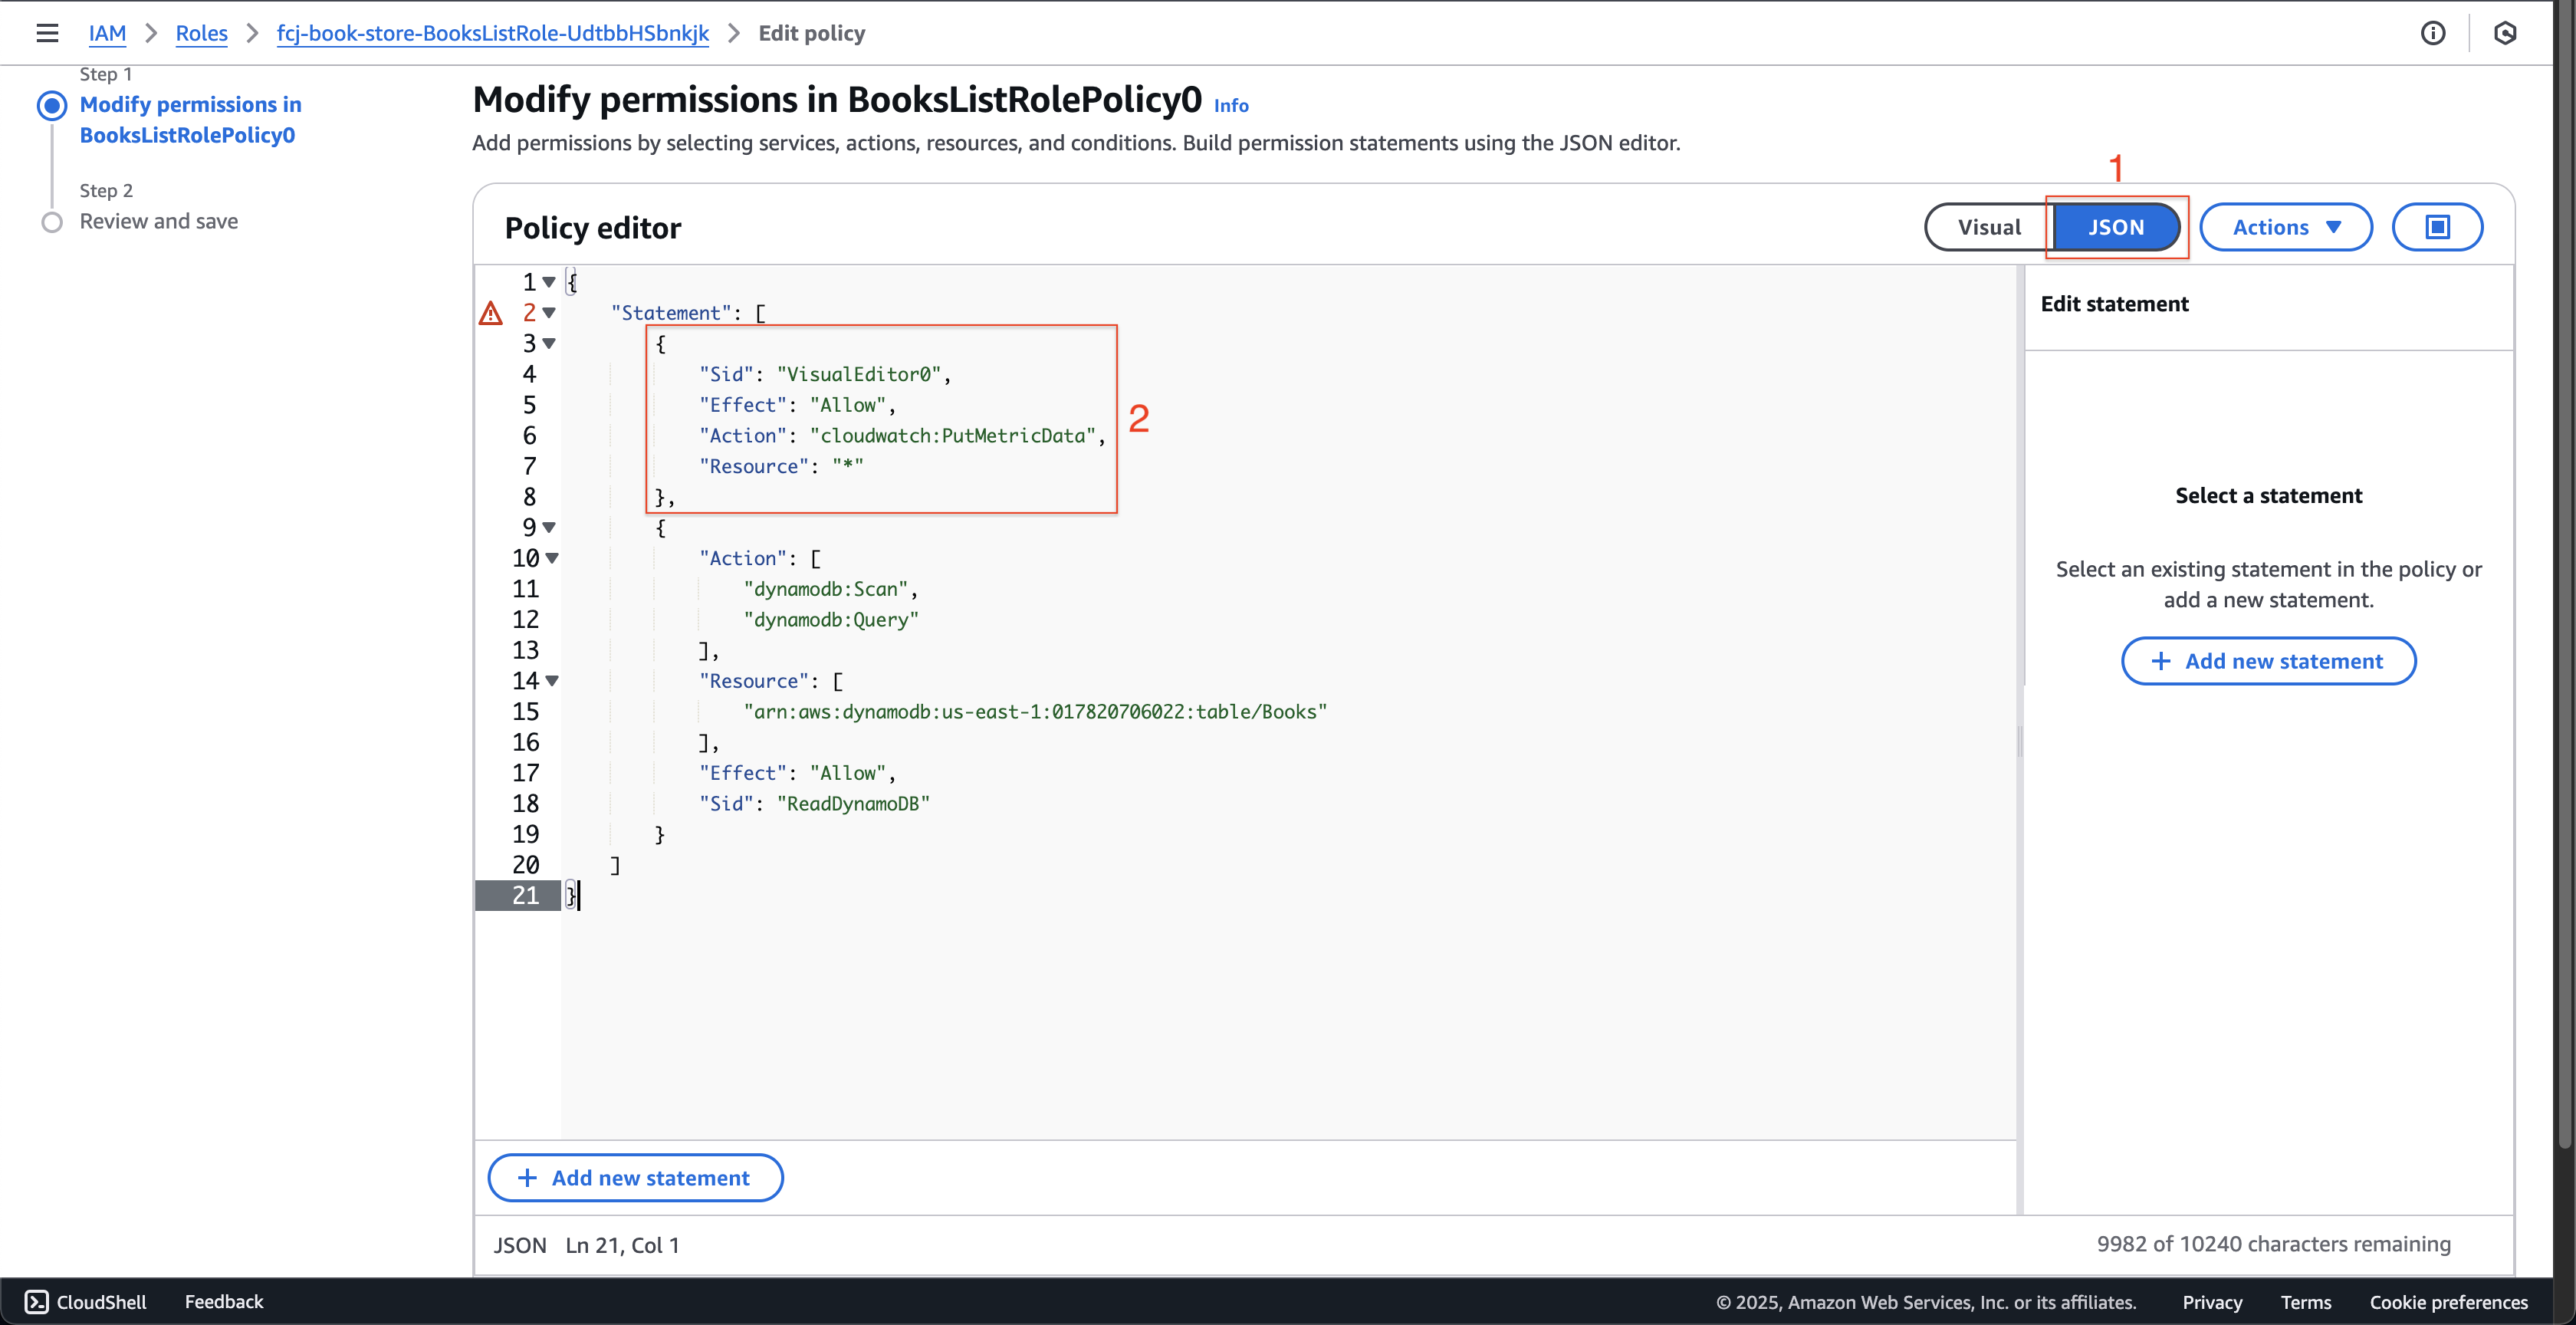
-
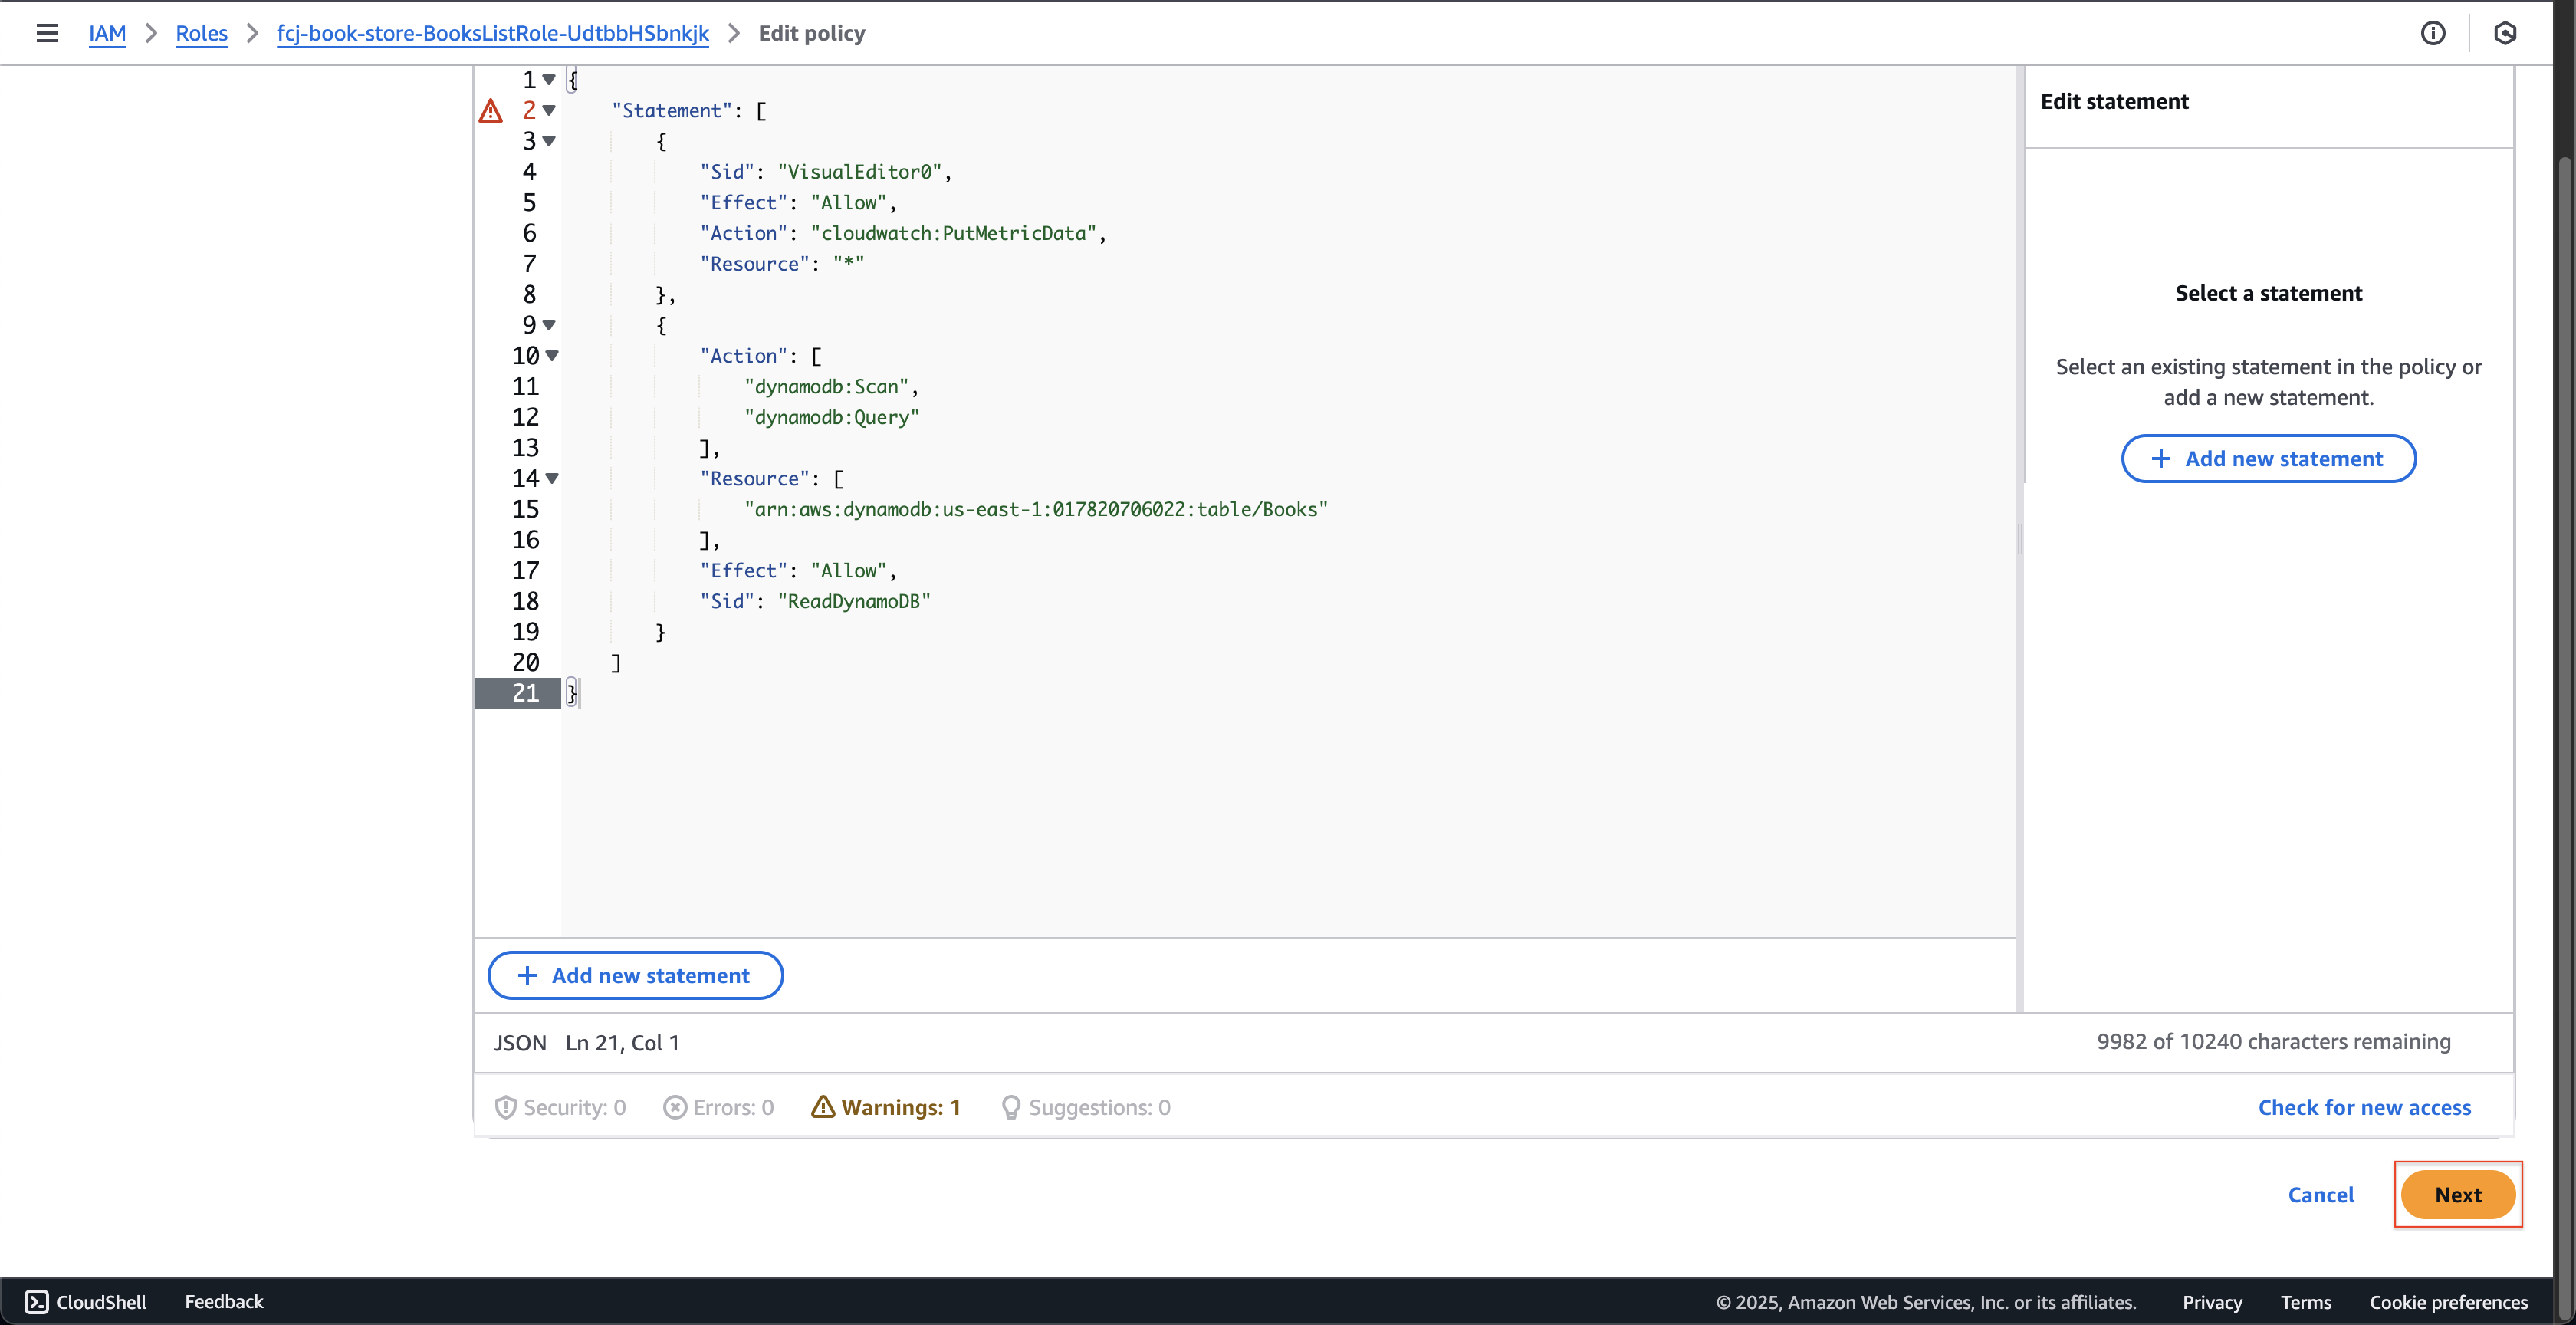
Cuộn xuống cuối trang và nhấn nút Next.
-
-
Tại trang Step 2: Review and save.
- Nhấn nút Save changes.
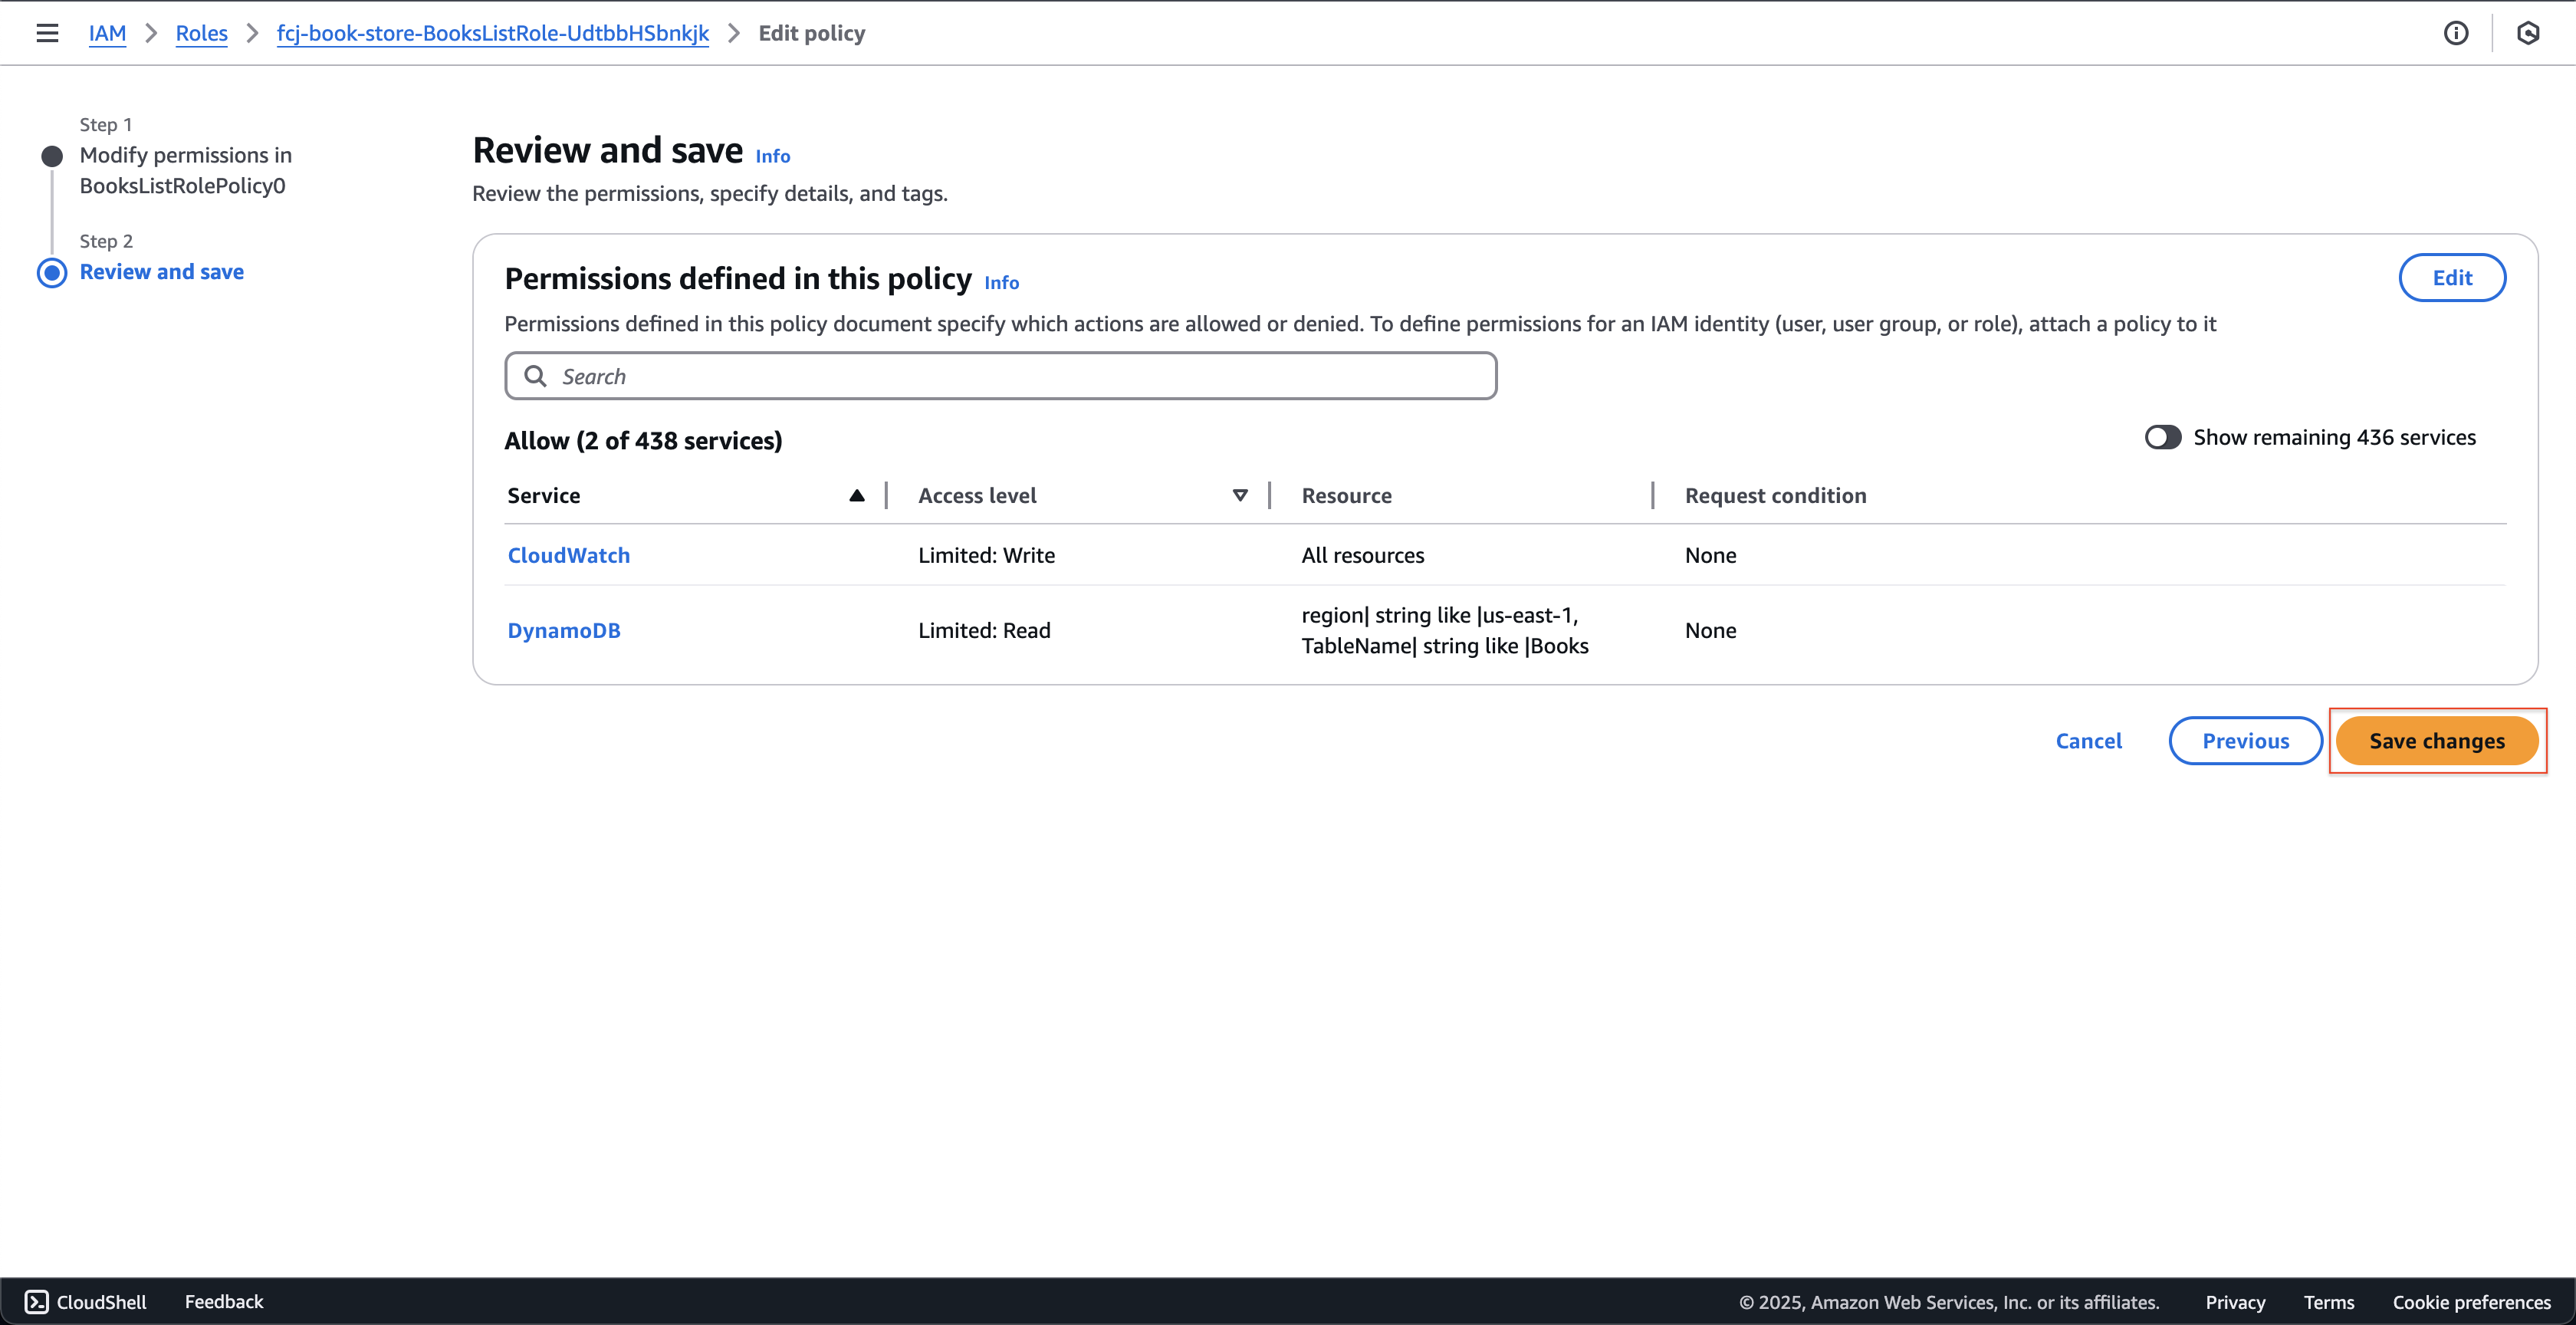
- Nhấn nút Save changes.
-
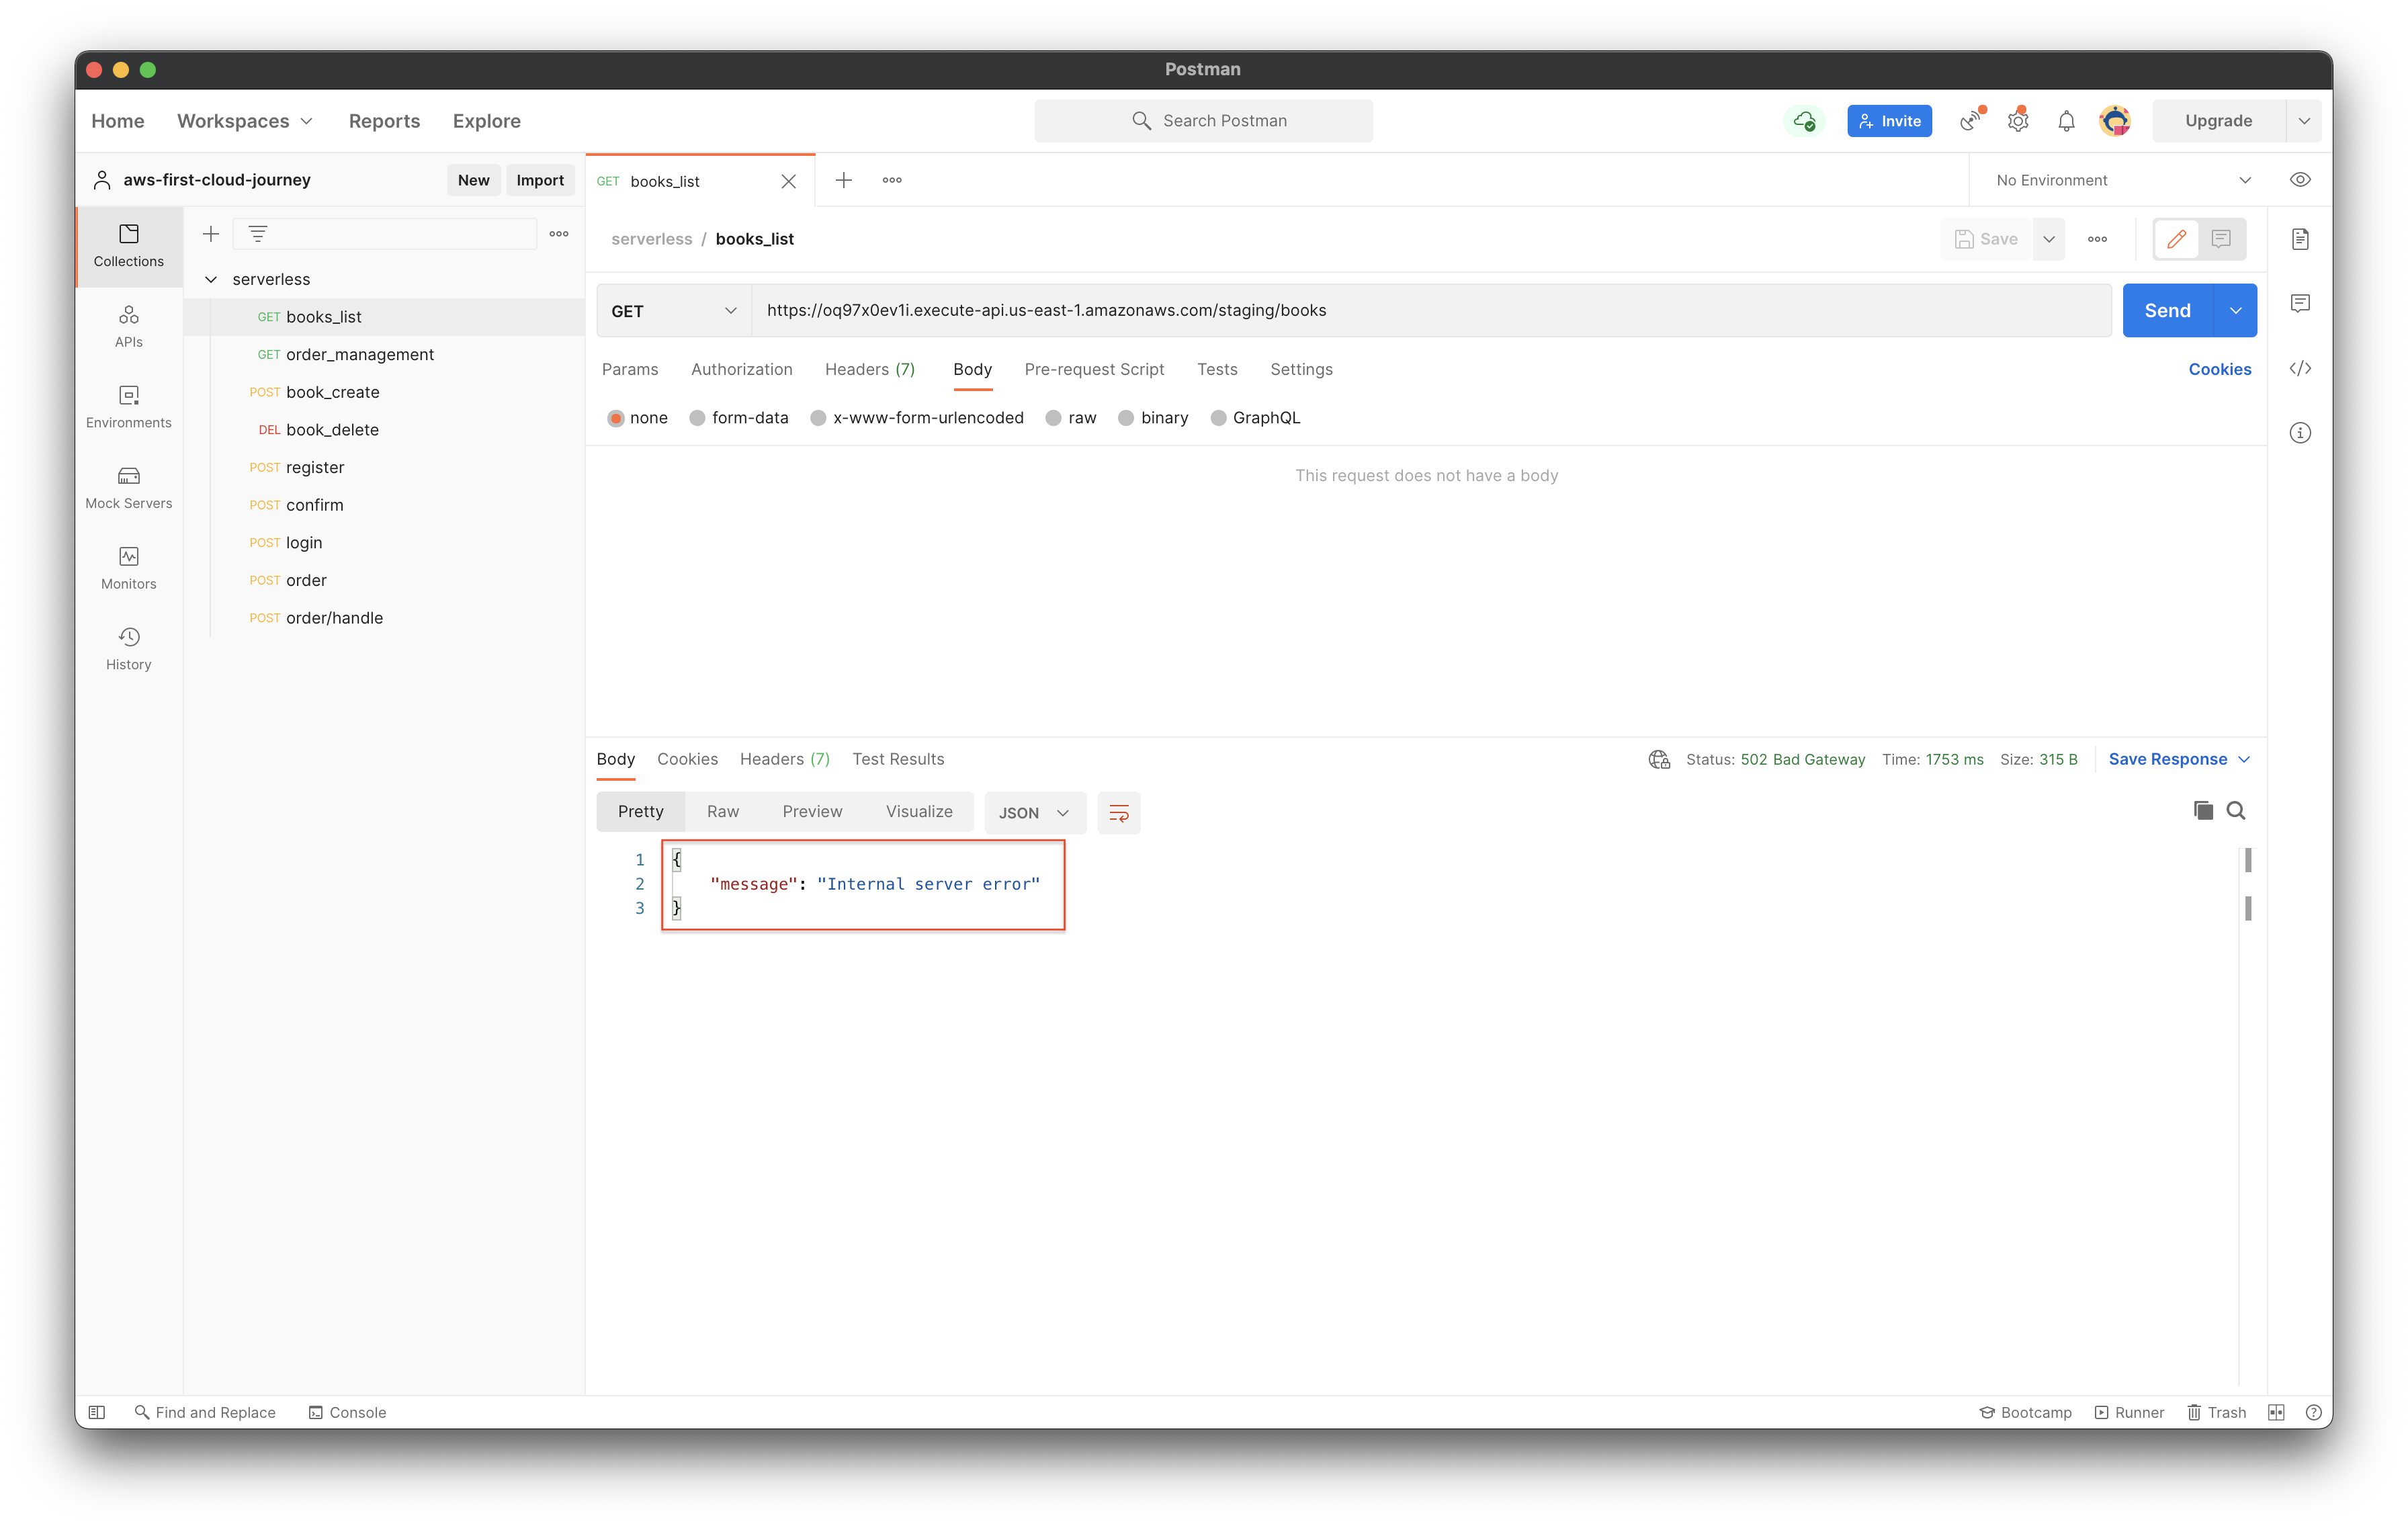
Mở Postman để gọi lại API, lỗi trả về là Internal server error.
-
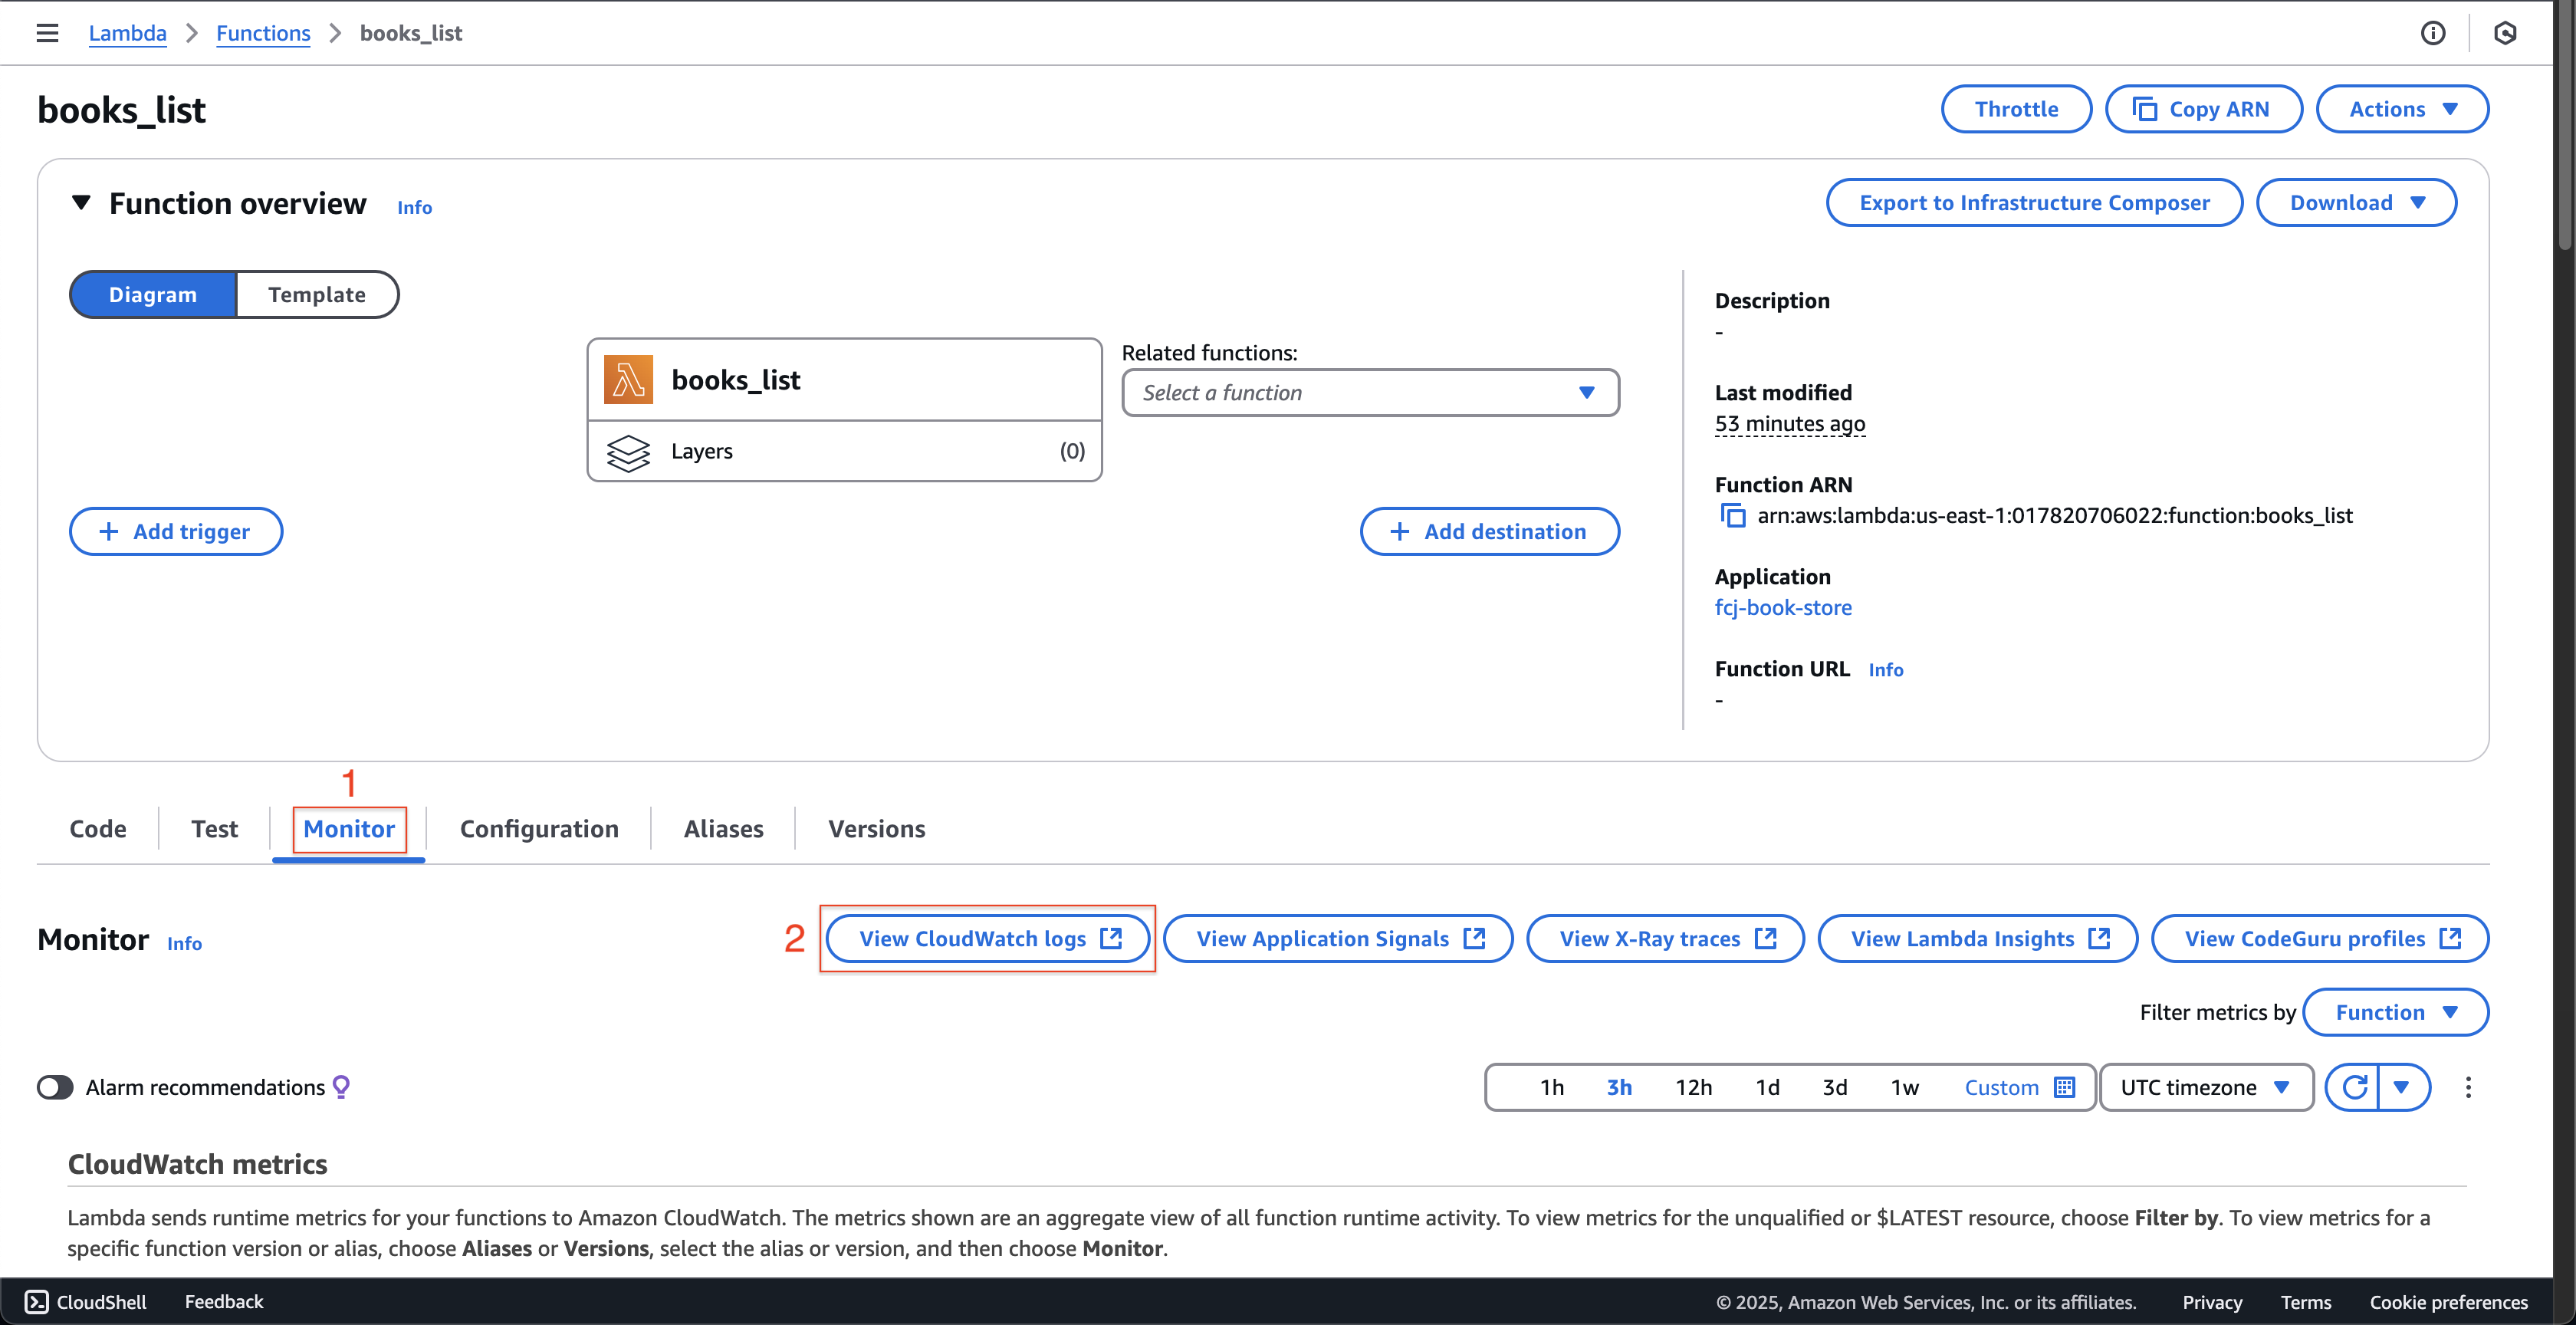
Quay lại trang hàm Lambda books_list.
- Nhấn tab Monitor.
- Nhấn nút View CloudWatch logs.
-
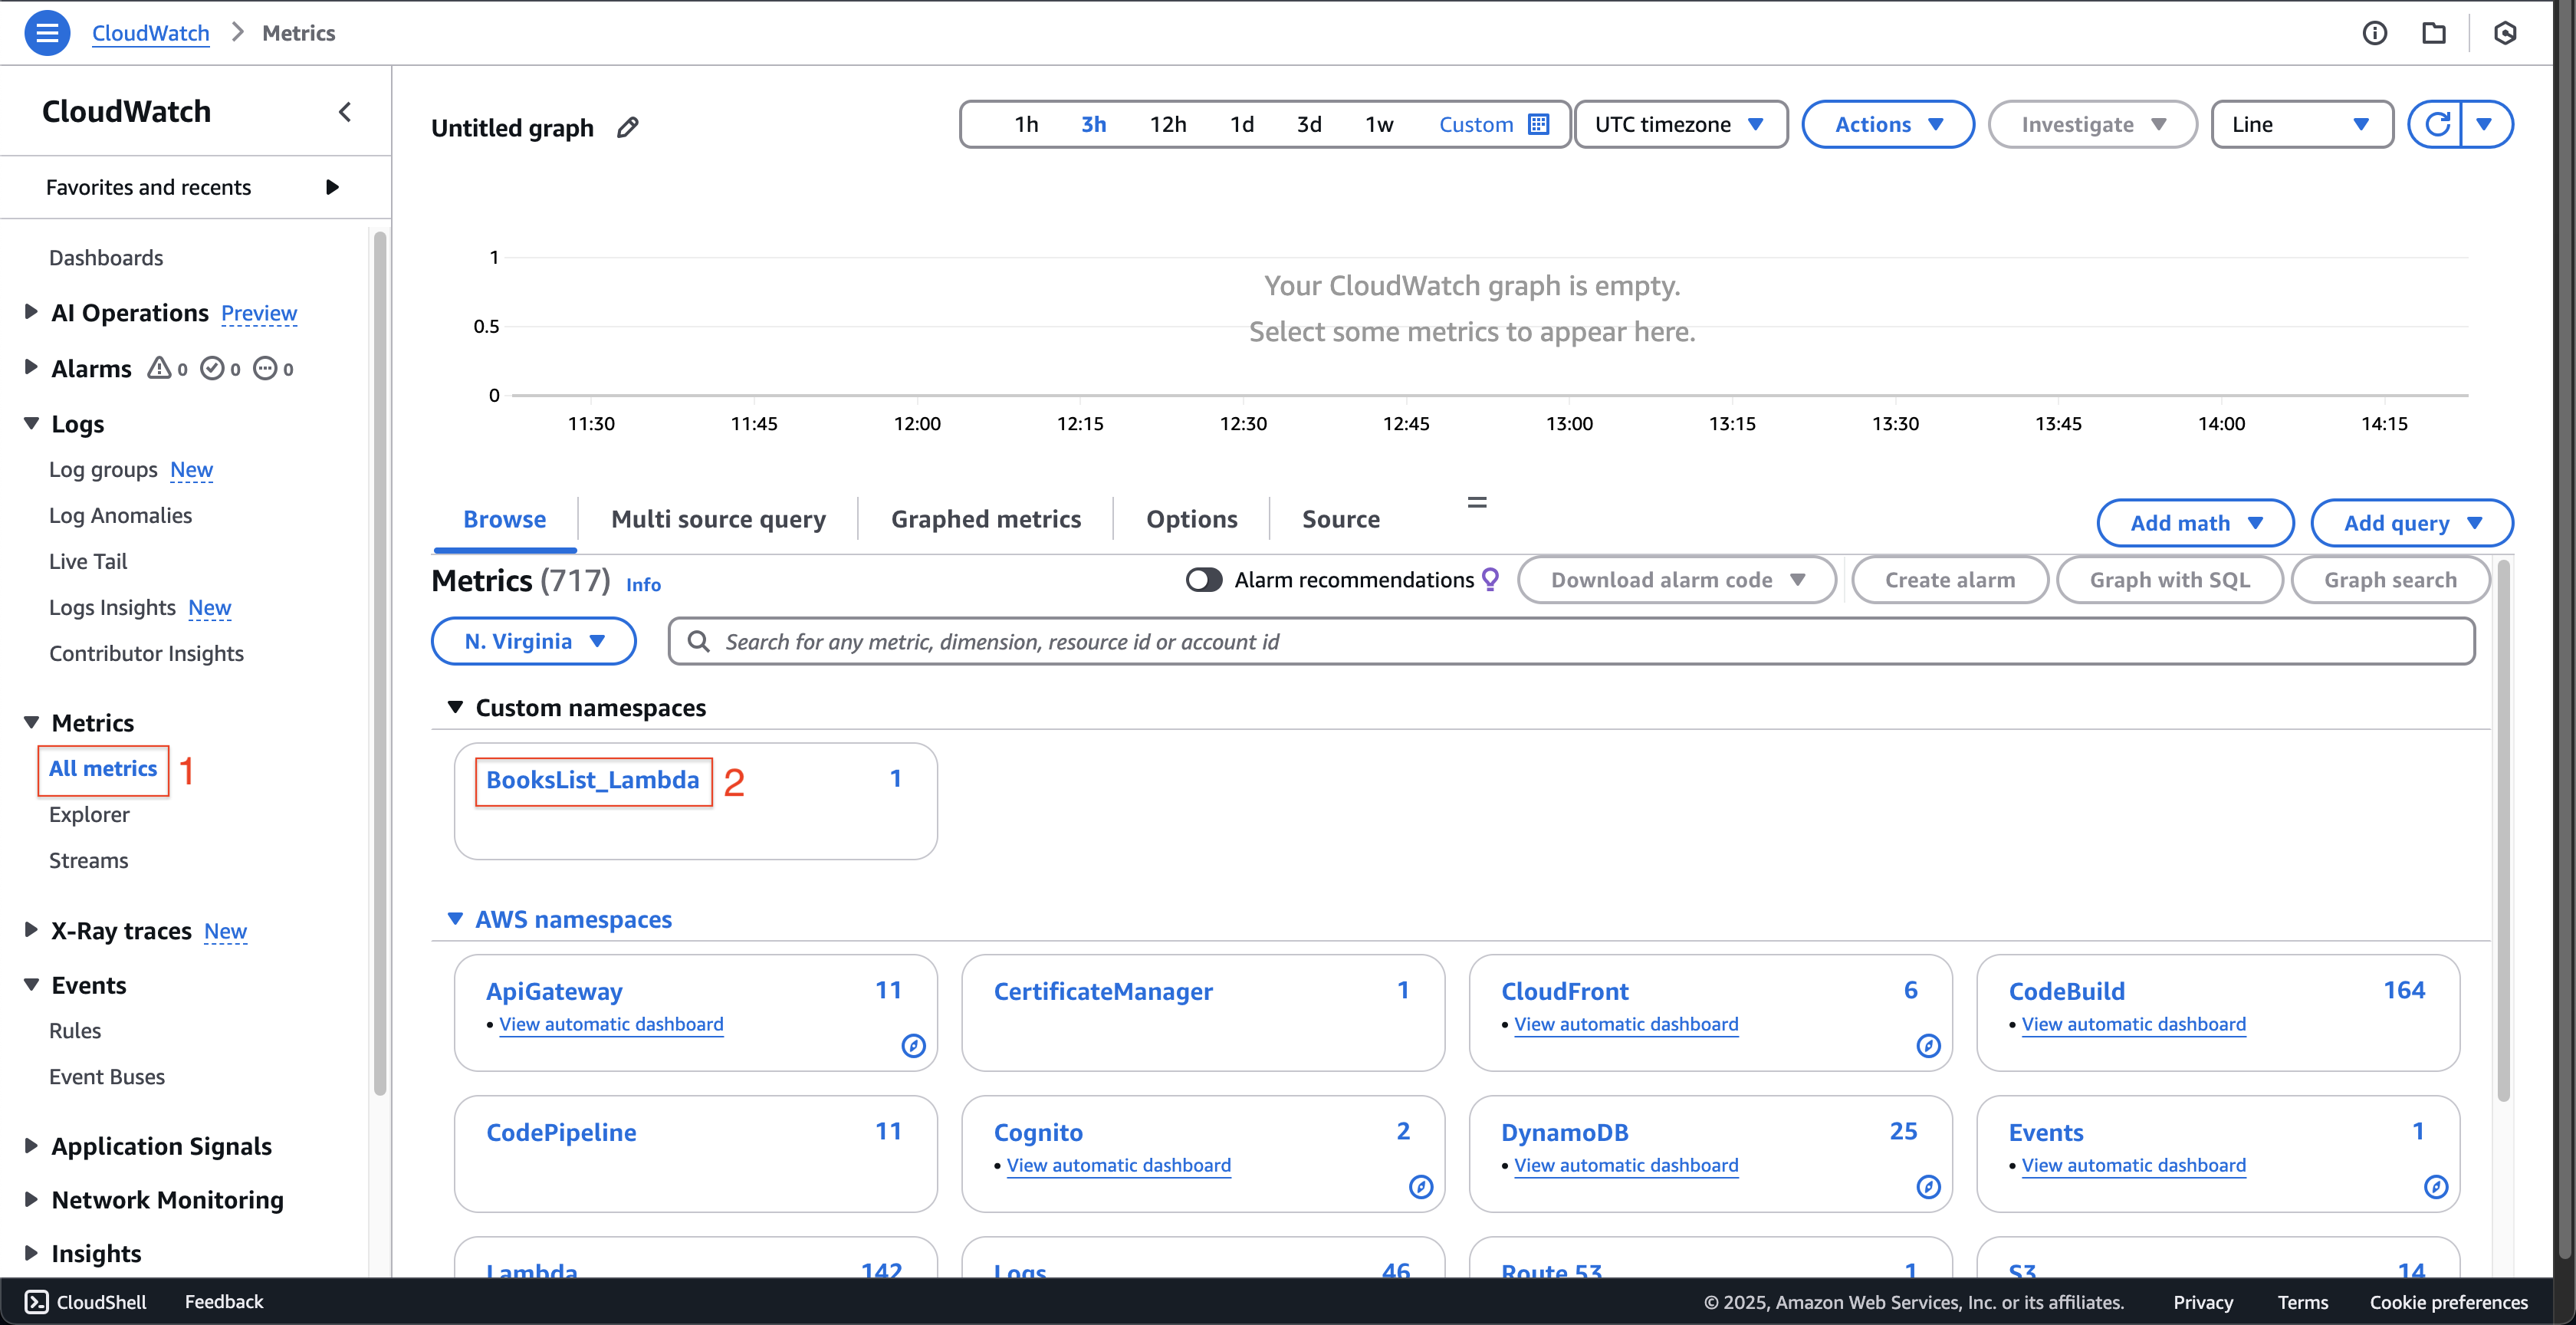
Tại trang CloudWatch.
- Nhấn All metrics trên menu bên trái.
- Nhấn BooksList_Lambda tại Custom namespaces.
- Tiếp theo, nhấn env.
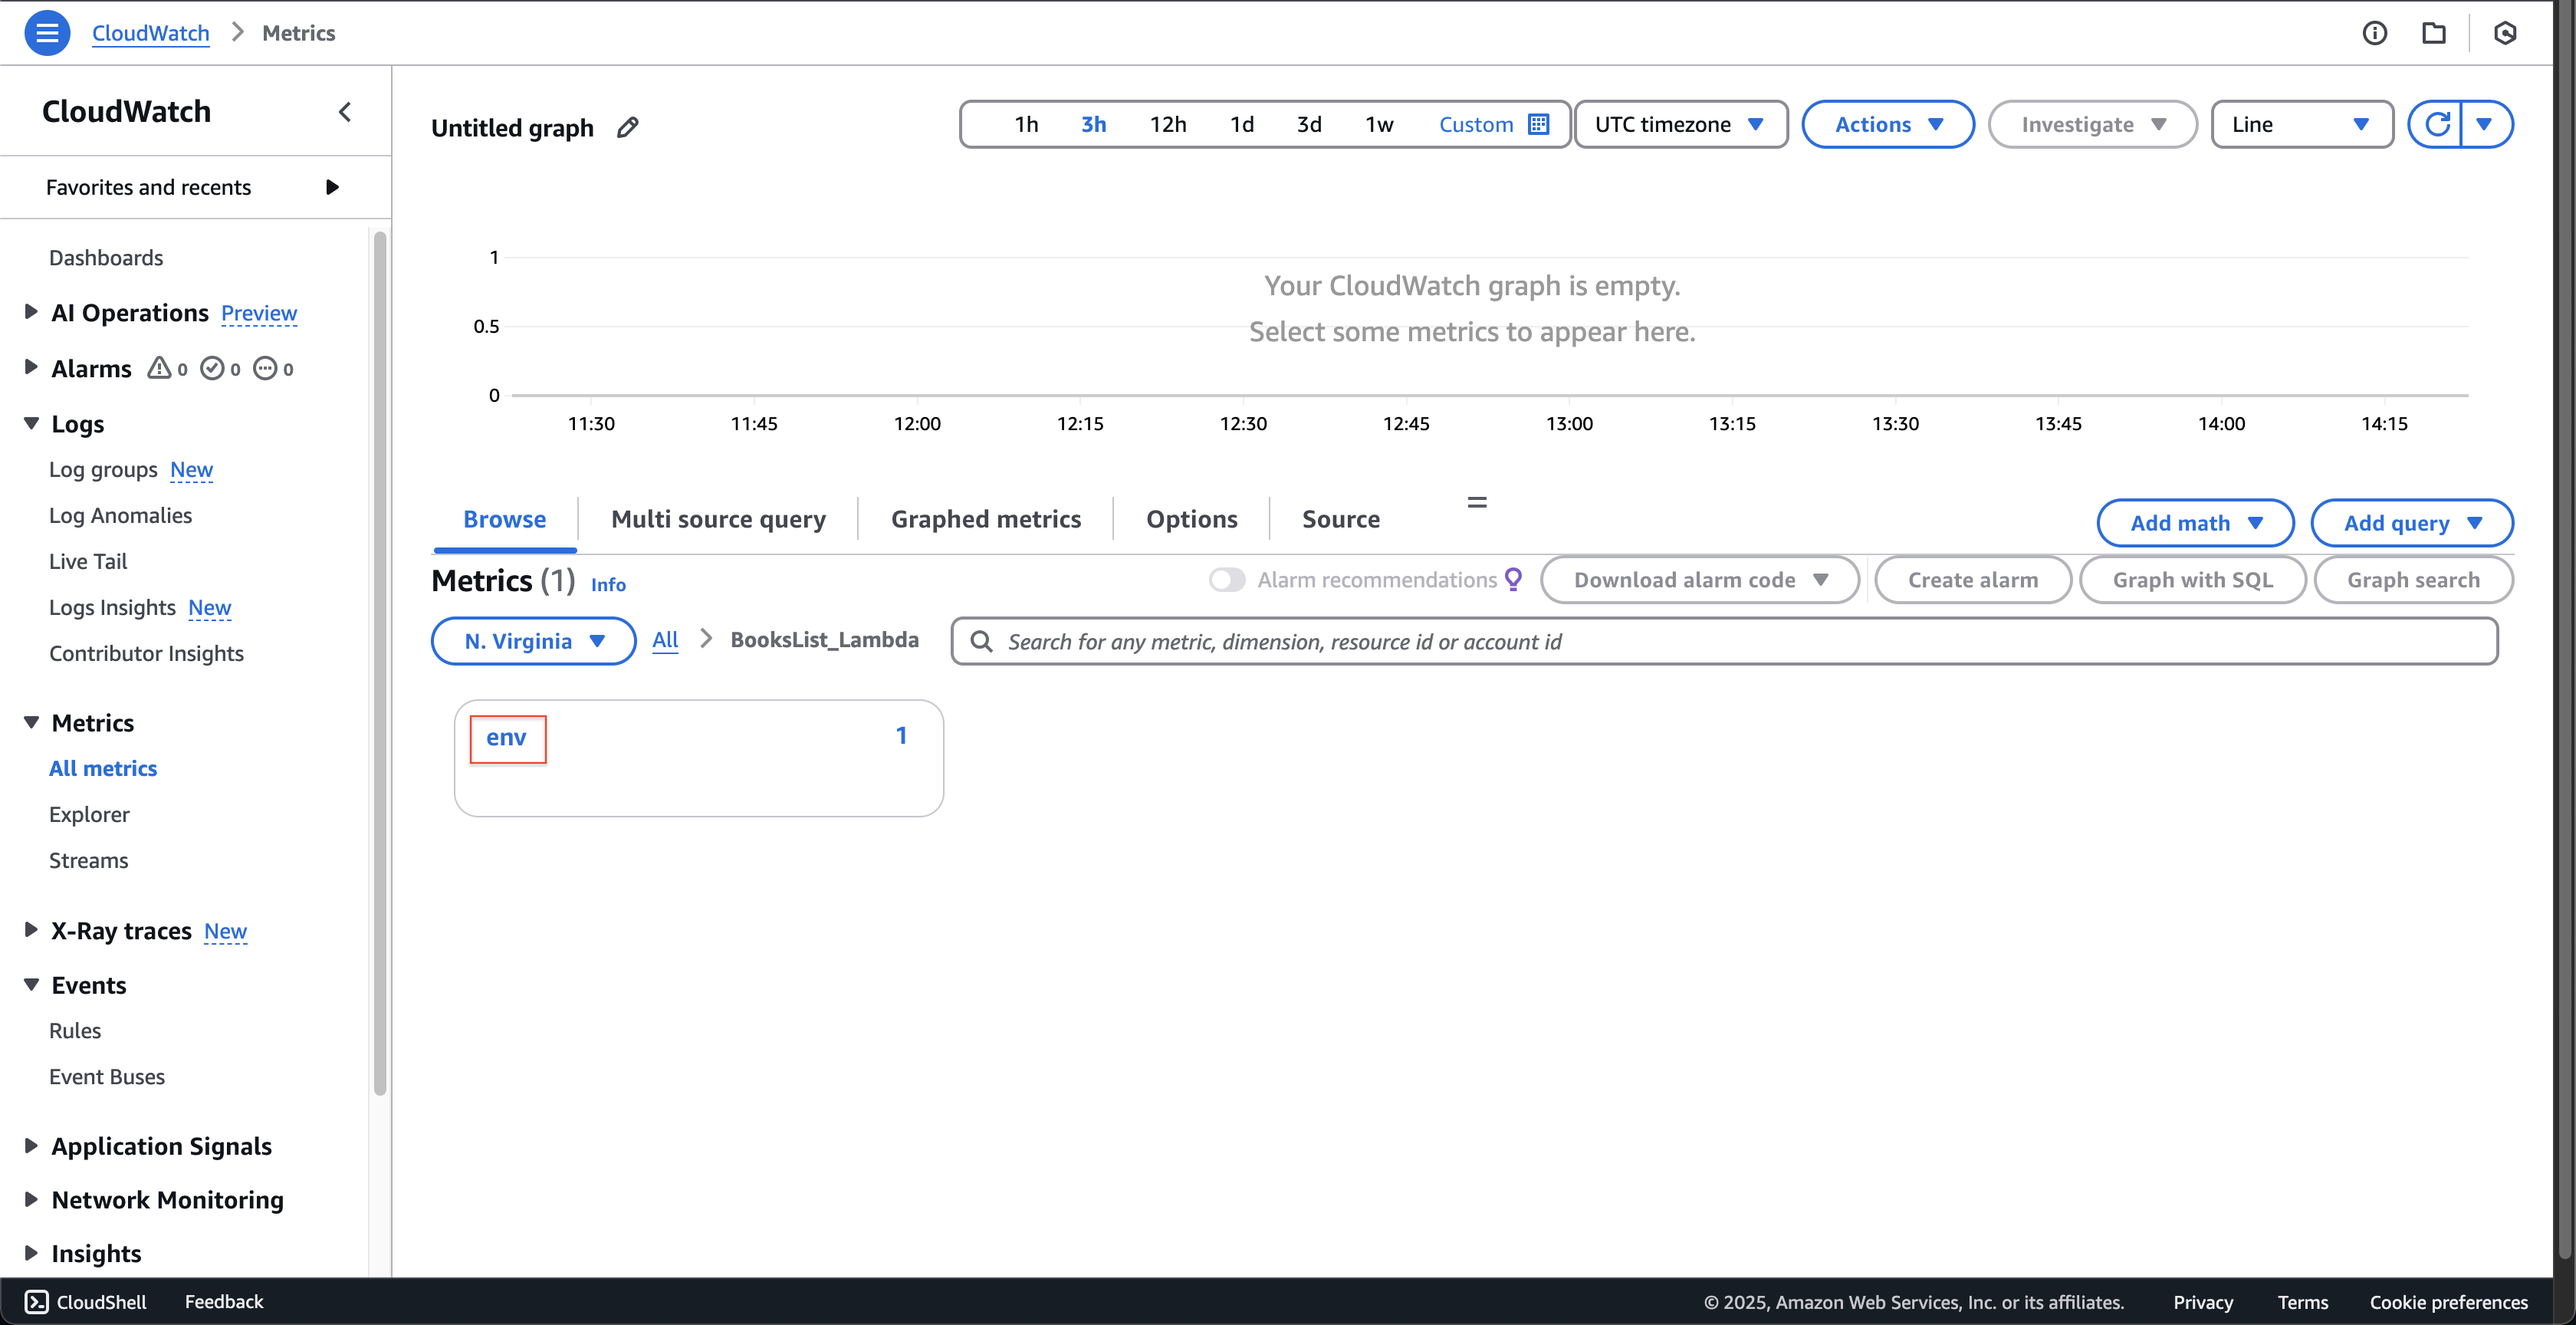
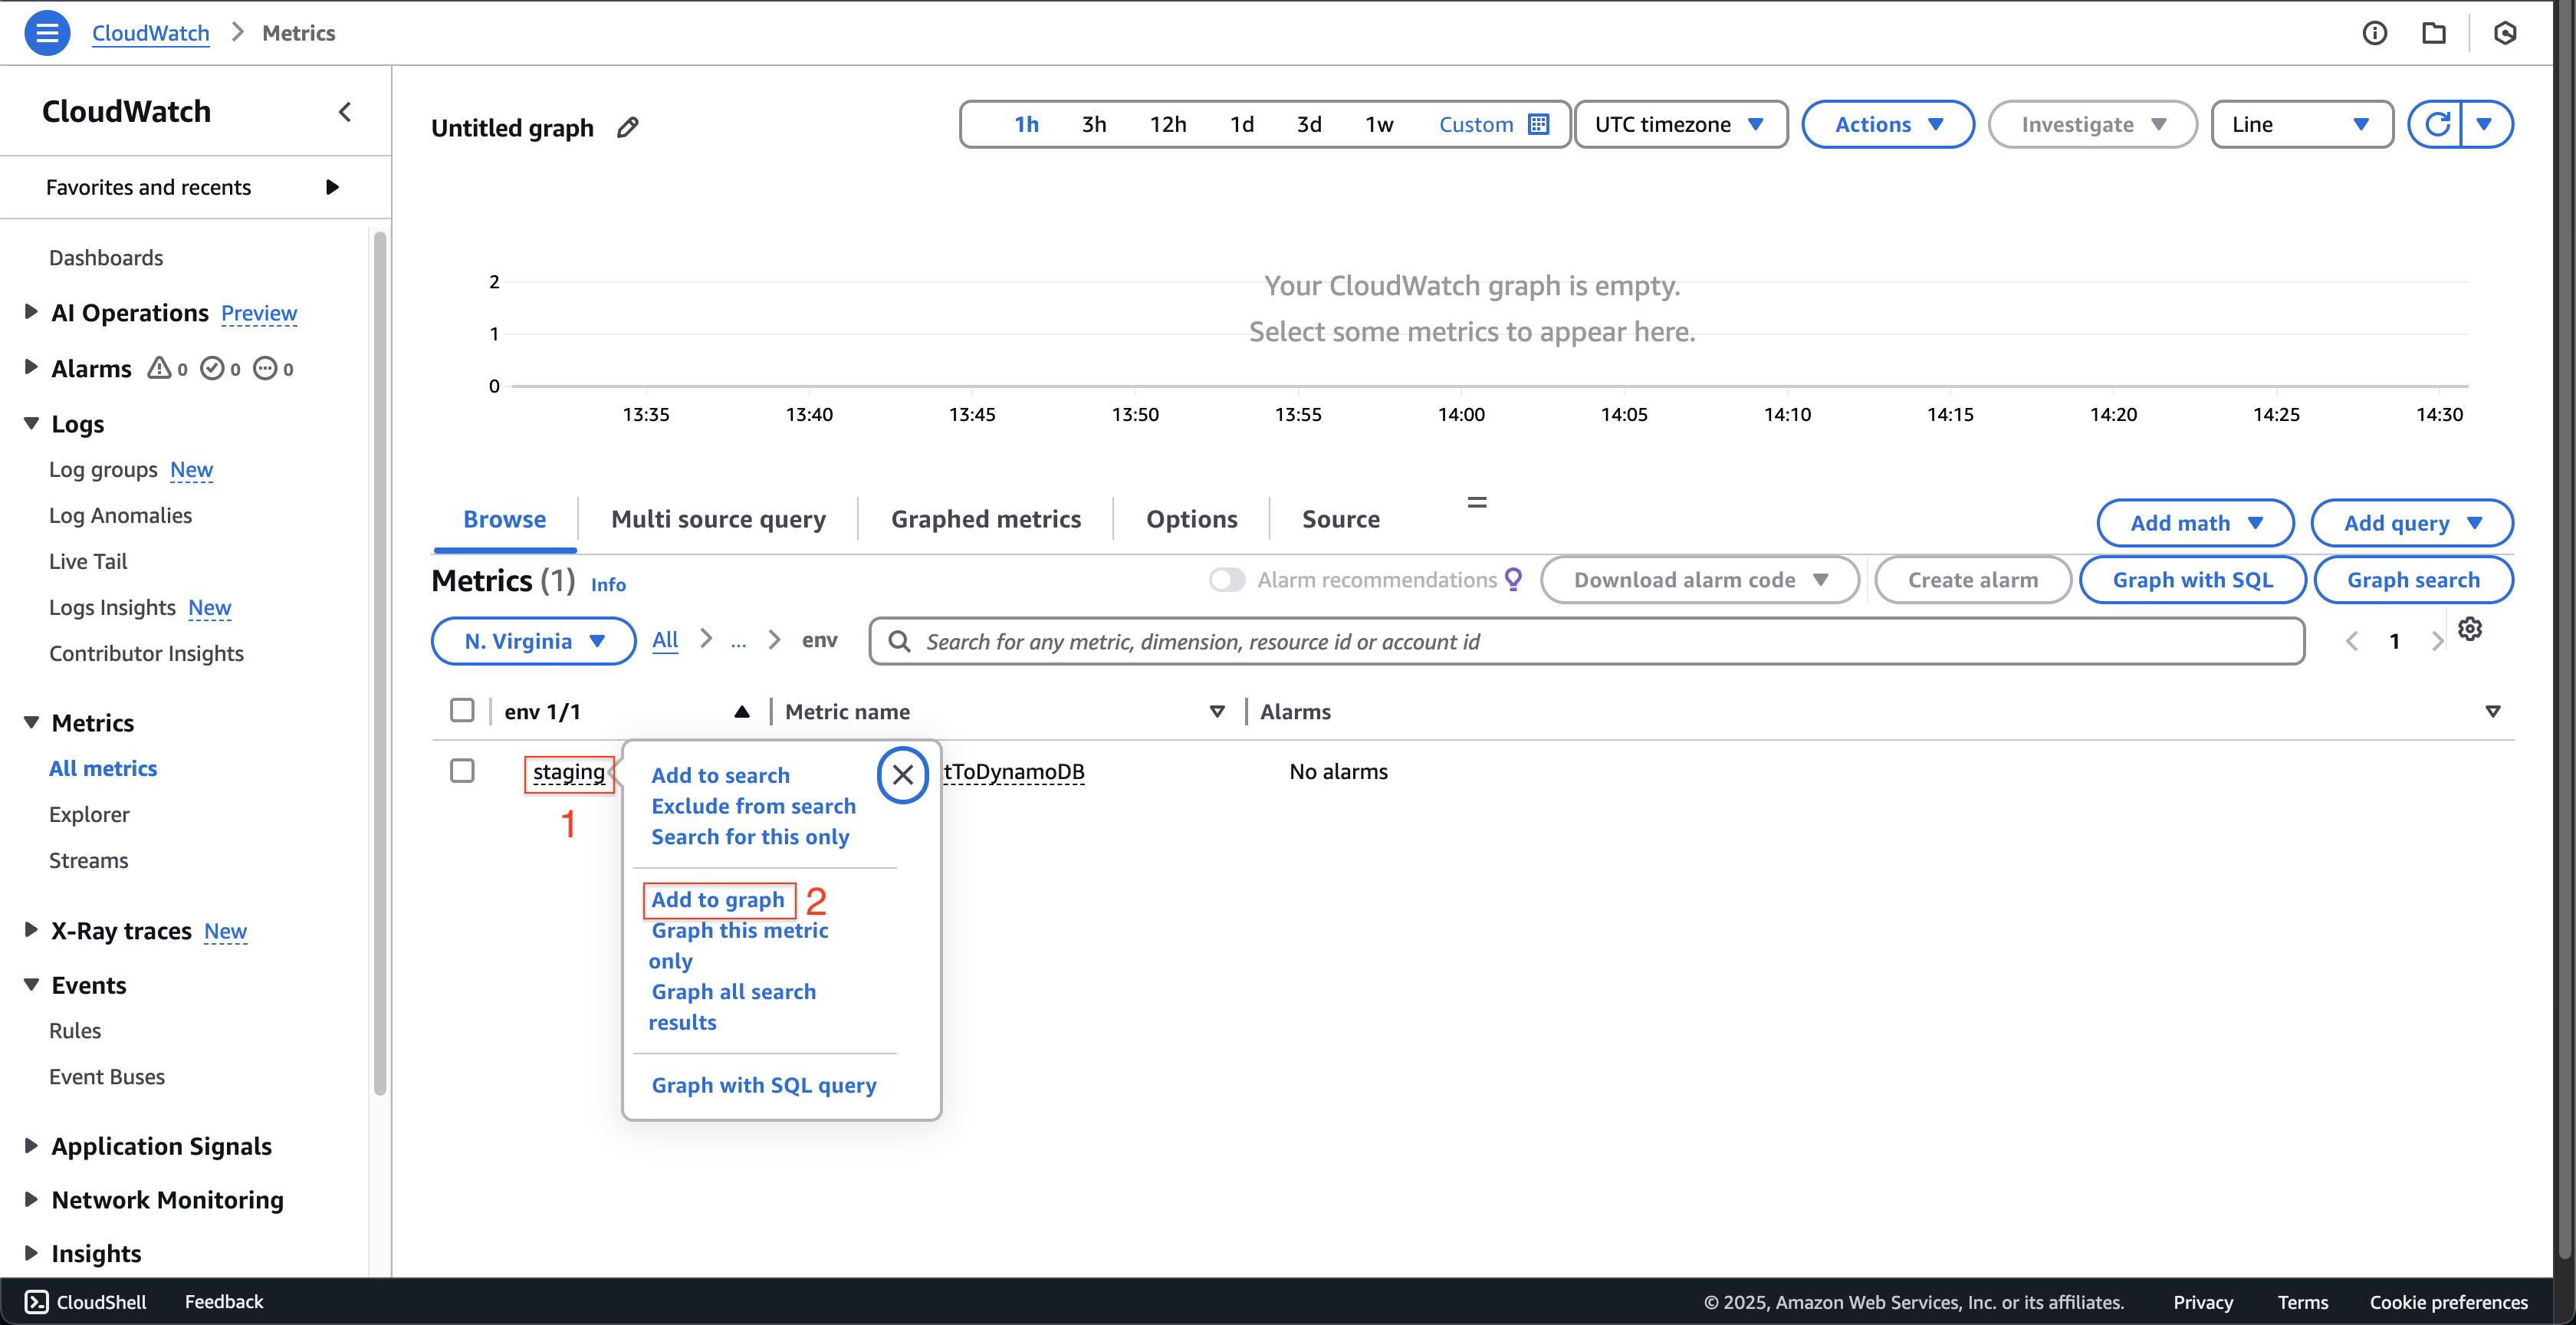
- Nhấn staging.
- Nhấn Add to graph.
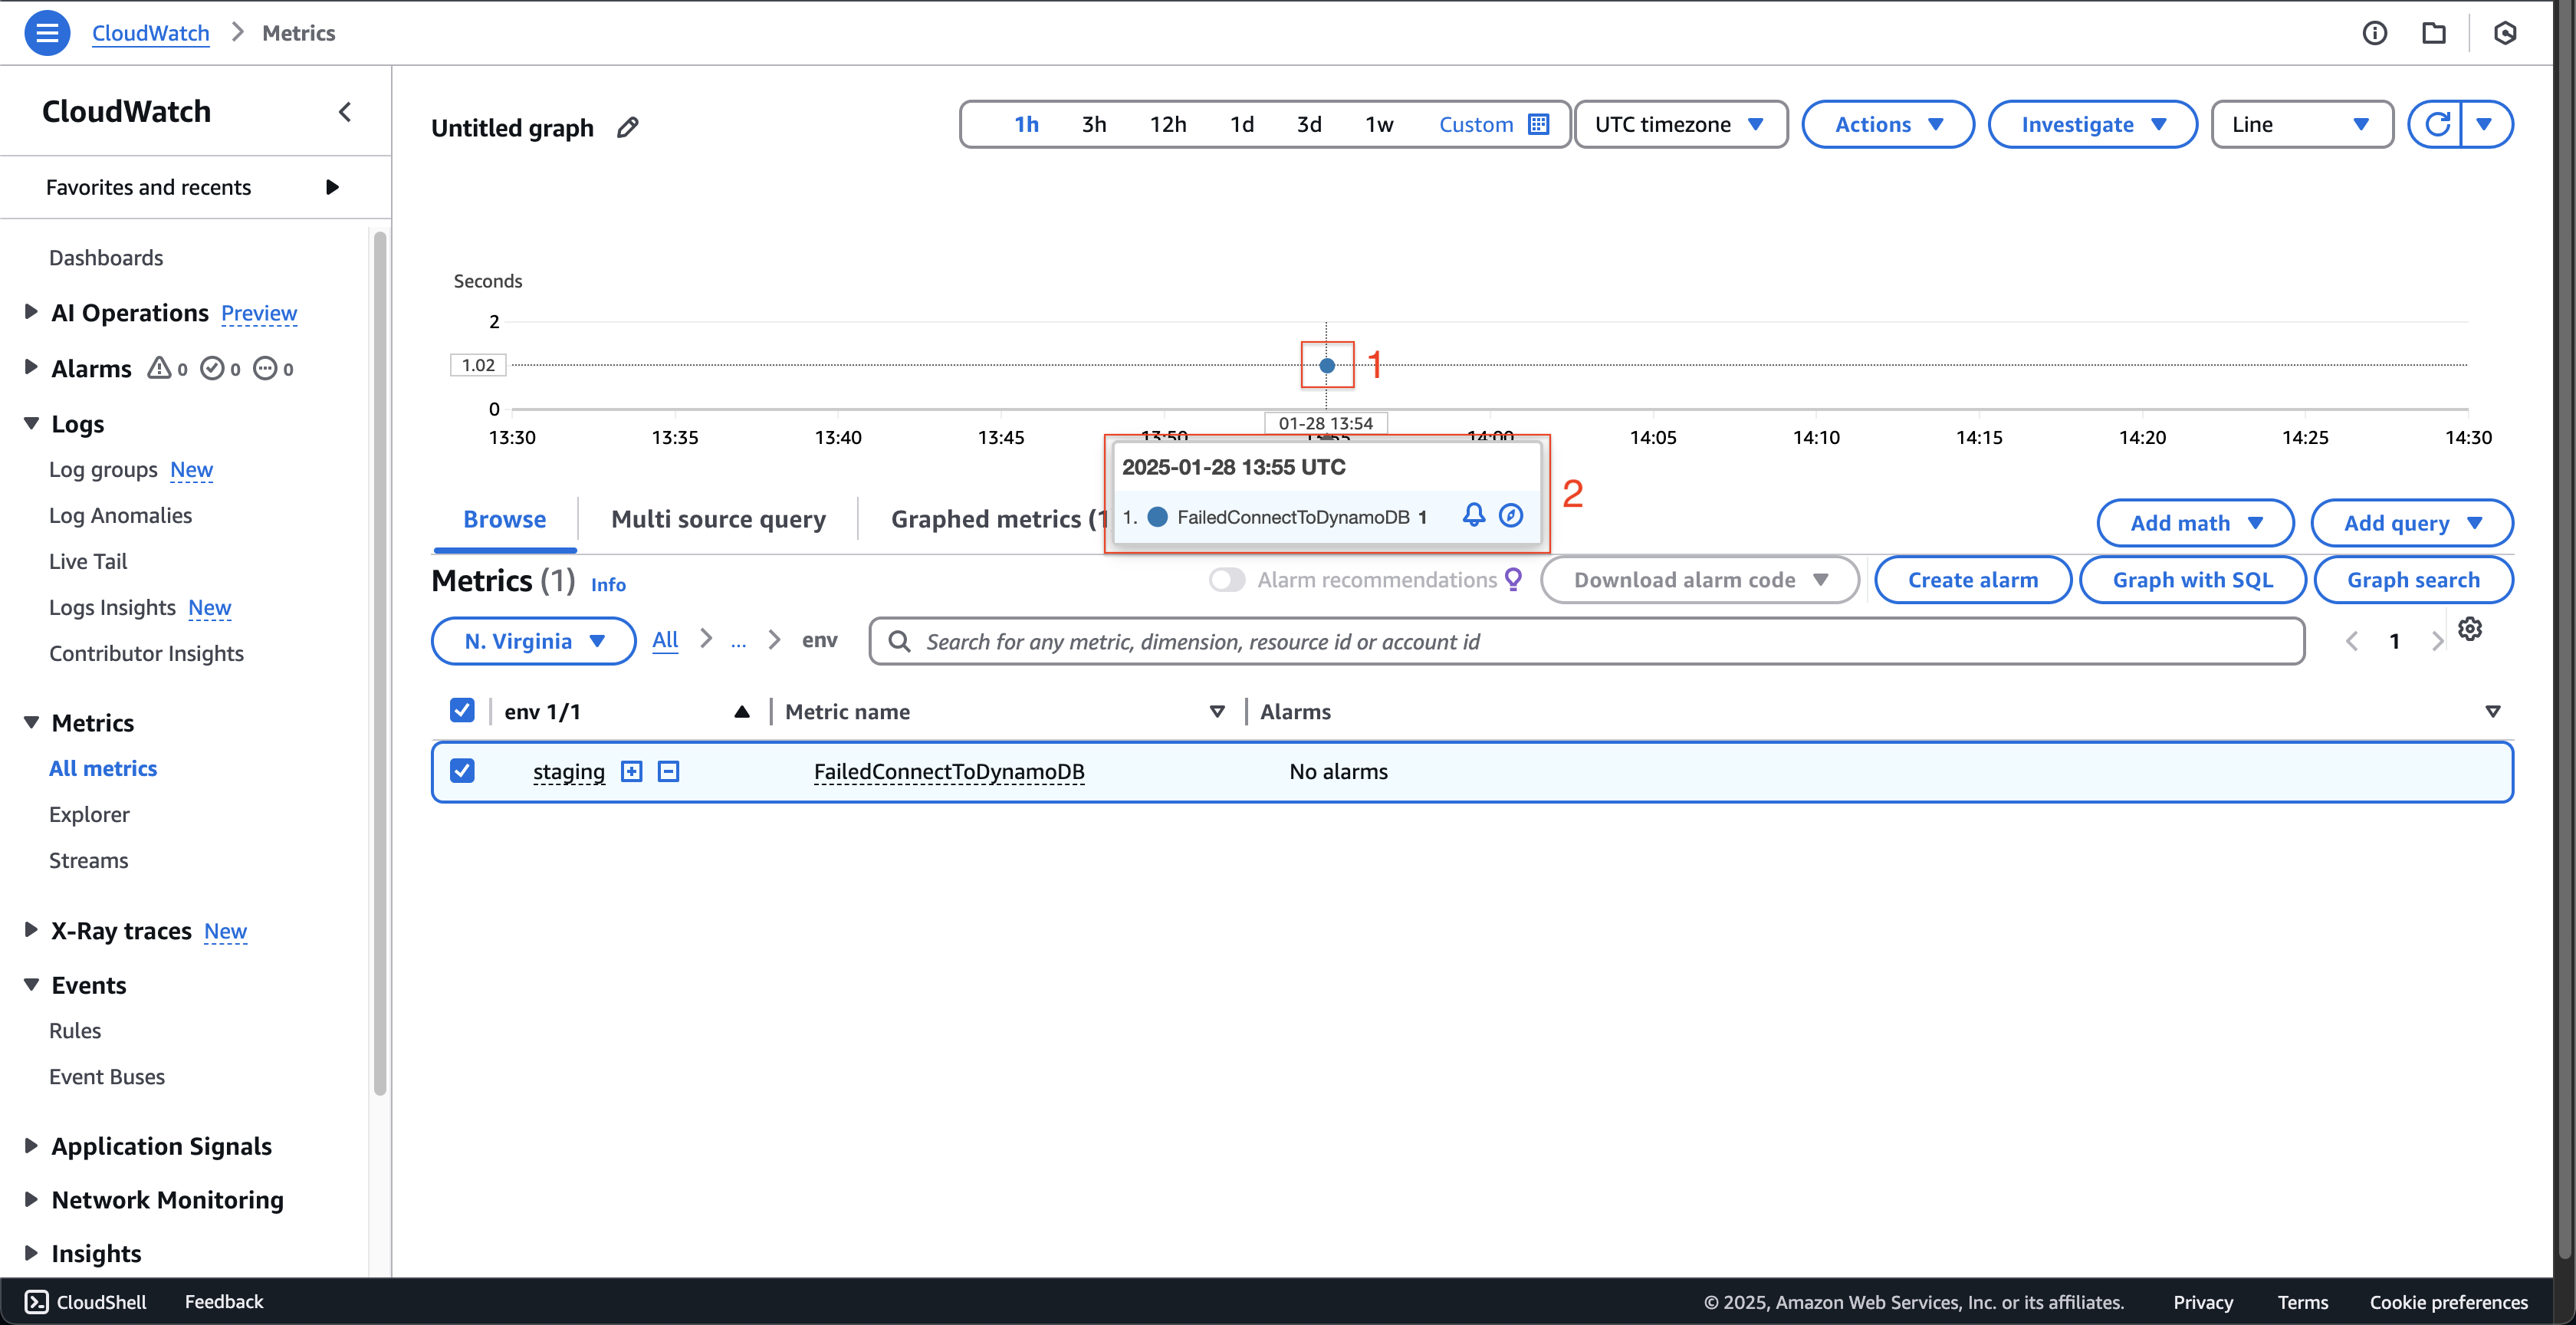
- Sau khi biểu đồ được làm mới, di chuột qua điểm Blue trên biểu đồ.
- Sau đó, bạn có thể thấy thông tin.
Vậy là chúng ta đã tạo thành công một số liệu tùy chỉnh. Bước tiếp theo chúng ta sẽ sử dụng nó để tạo một CloudWatch Alarm.