Tracing with X-ray
In this section we will enable X-ray for the Lambda function to track incoming and outgoing requests to the function, knowing how much time each segment of the function takes. Then we will know where the function is slow and from there easily optimize it.
-
Open AWS Lambda console.
- Click Functions on the left menu.
- Choose the book_delete function.

-
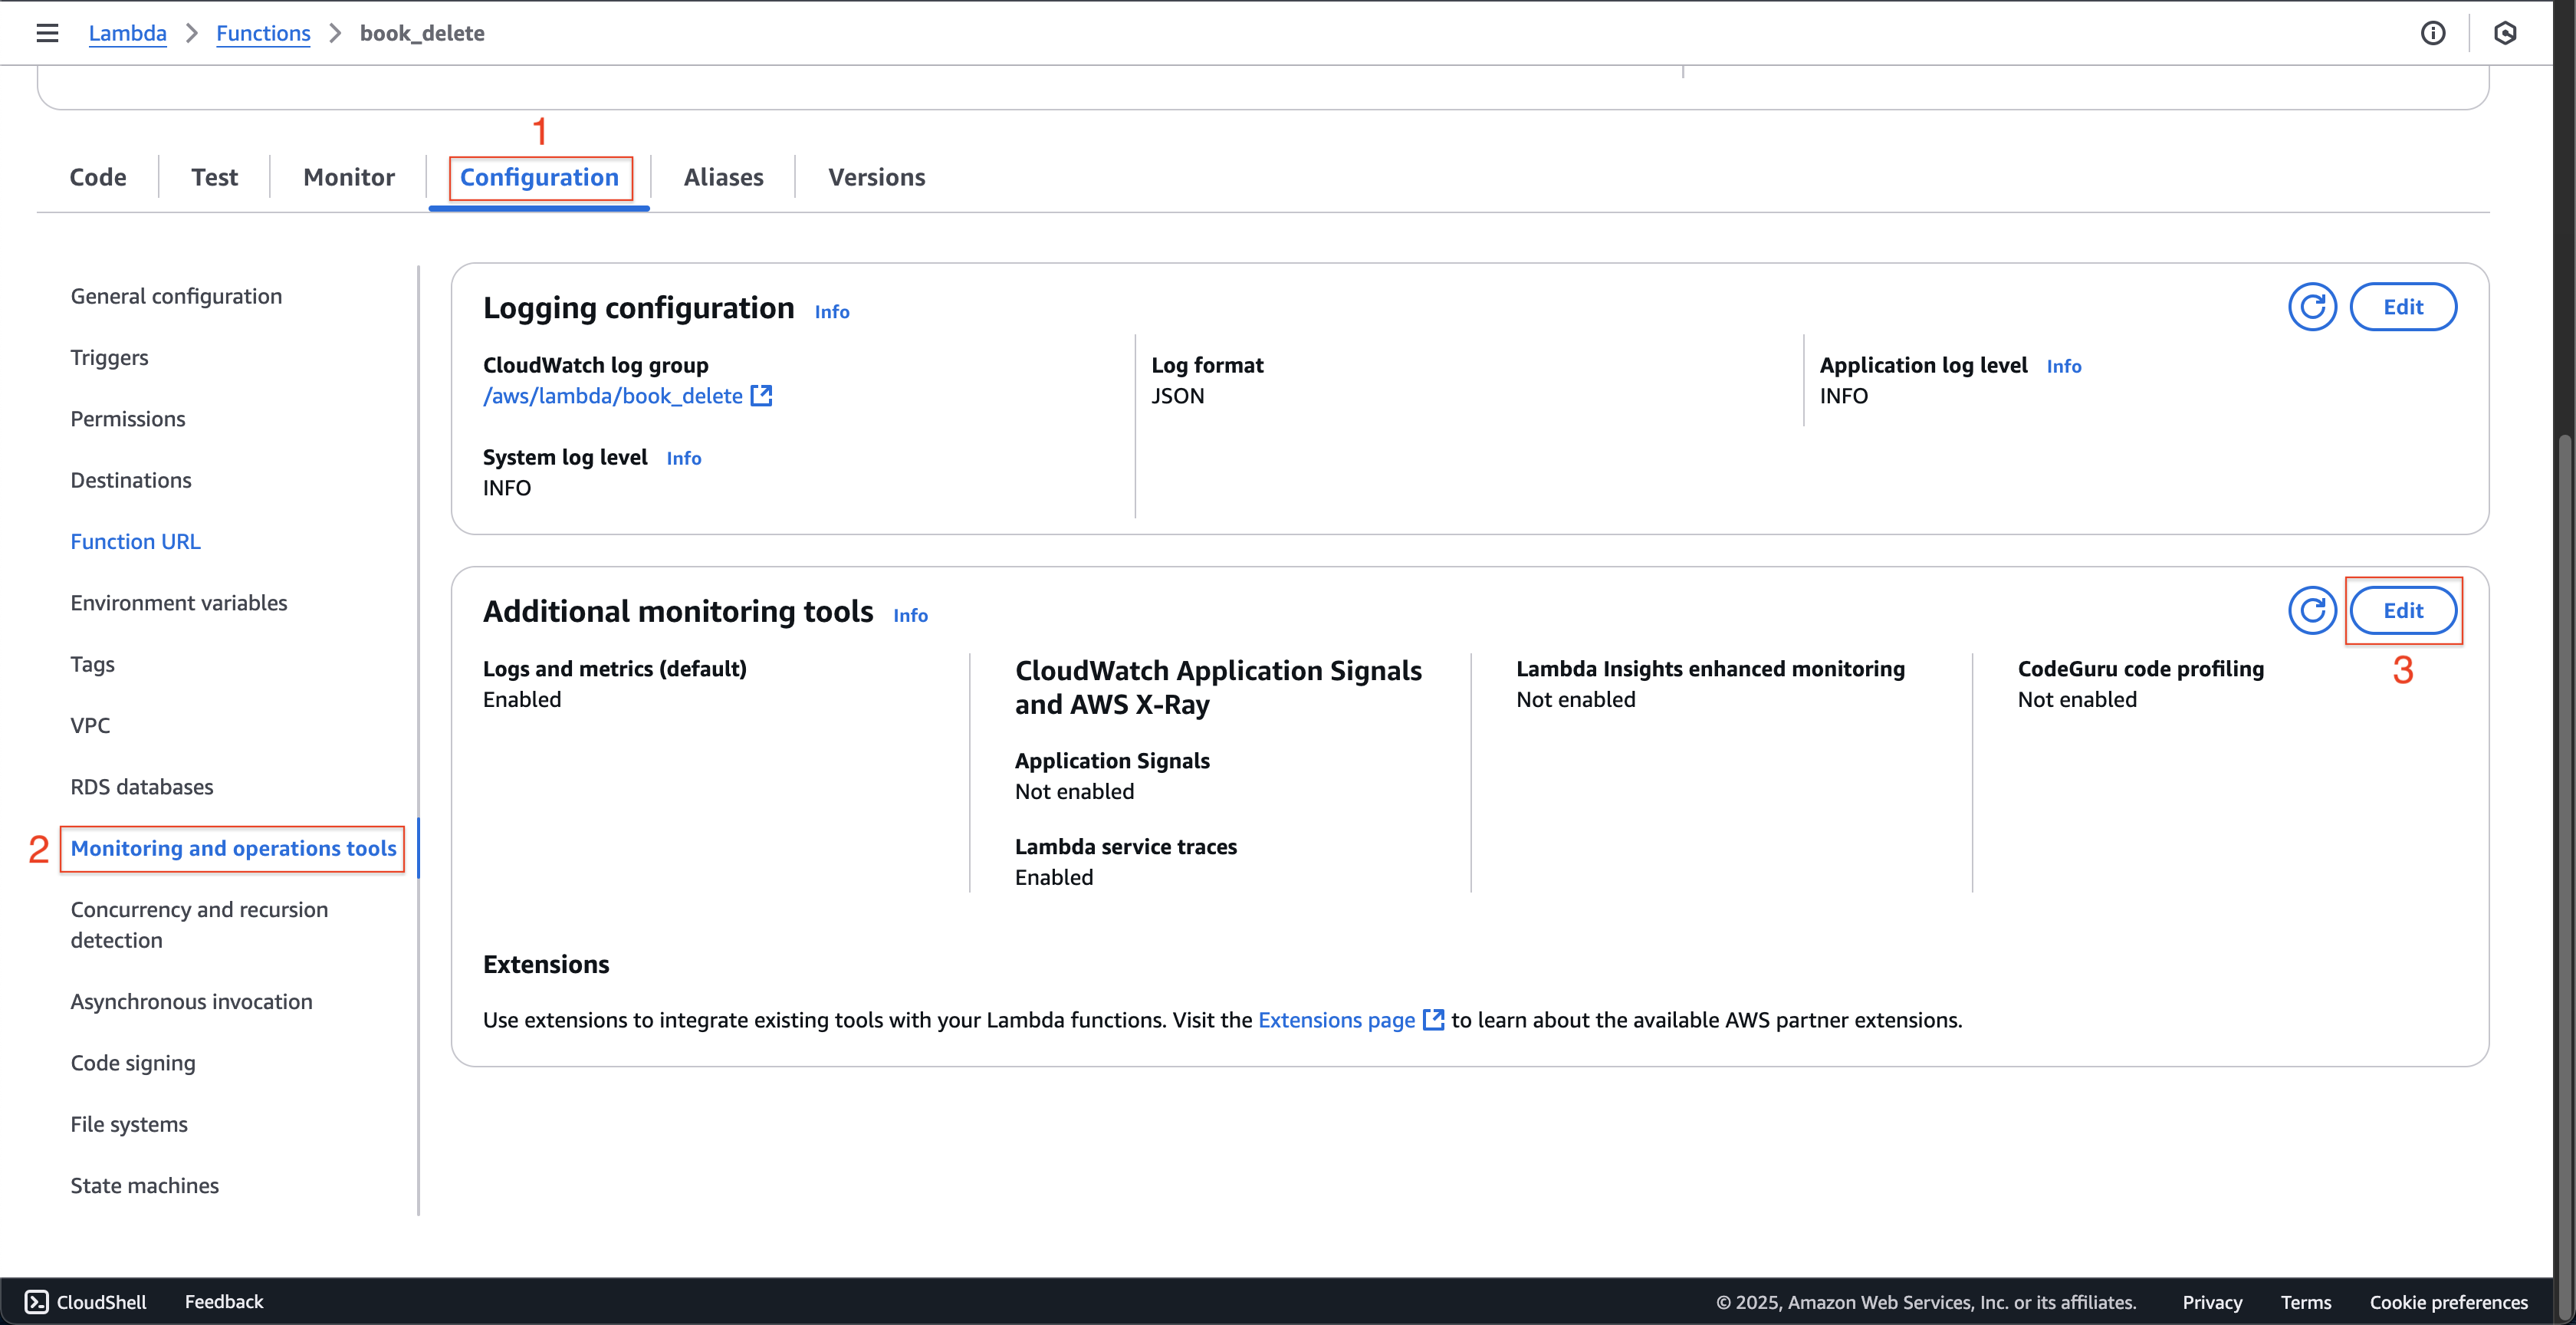
At book_delete page.
- Click the Configuration tab.
- Click the Monitoring and operations tools on the lef menu.
- Click the Edit button.
-
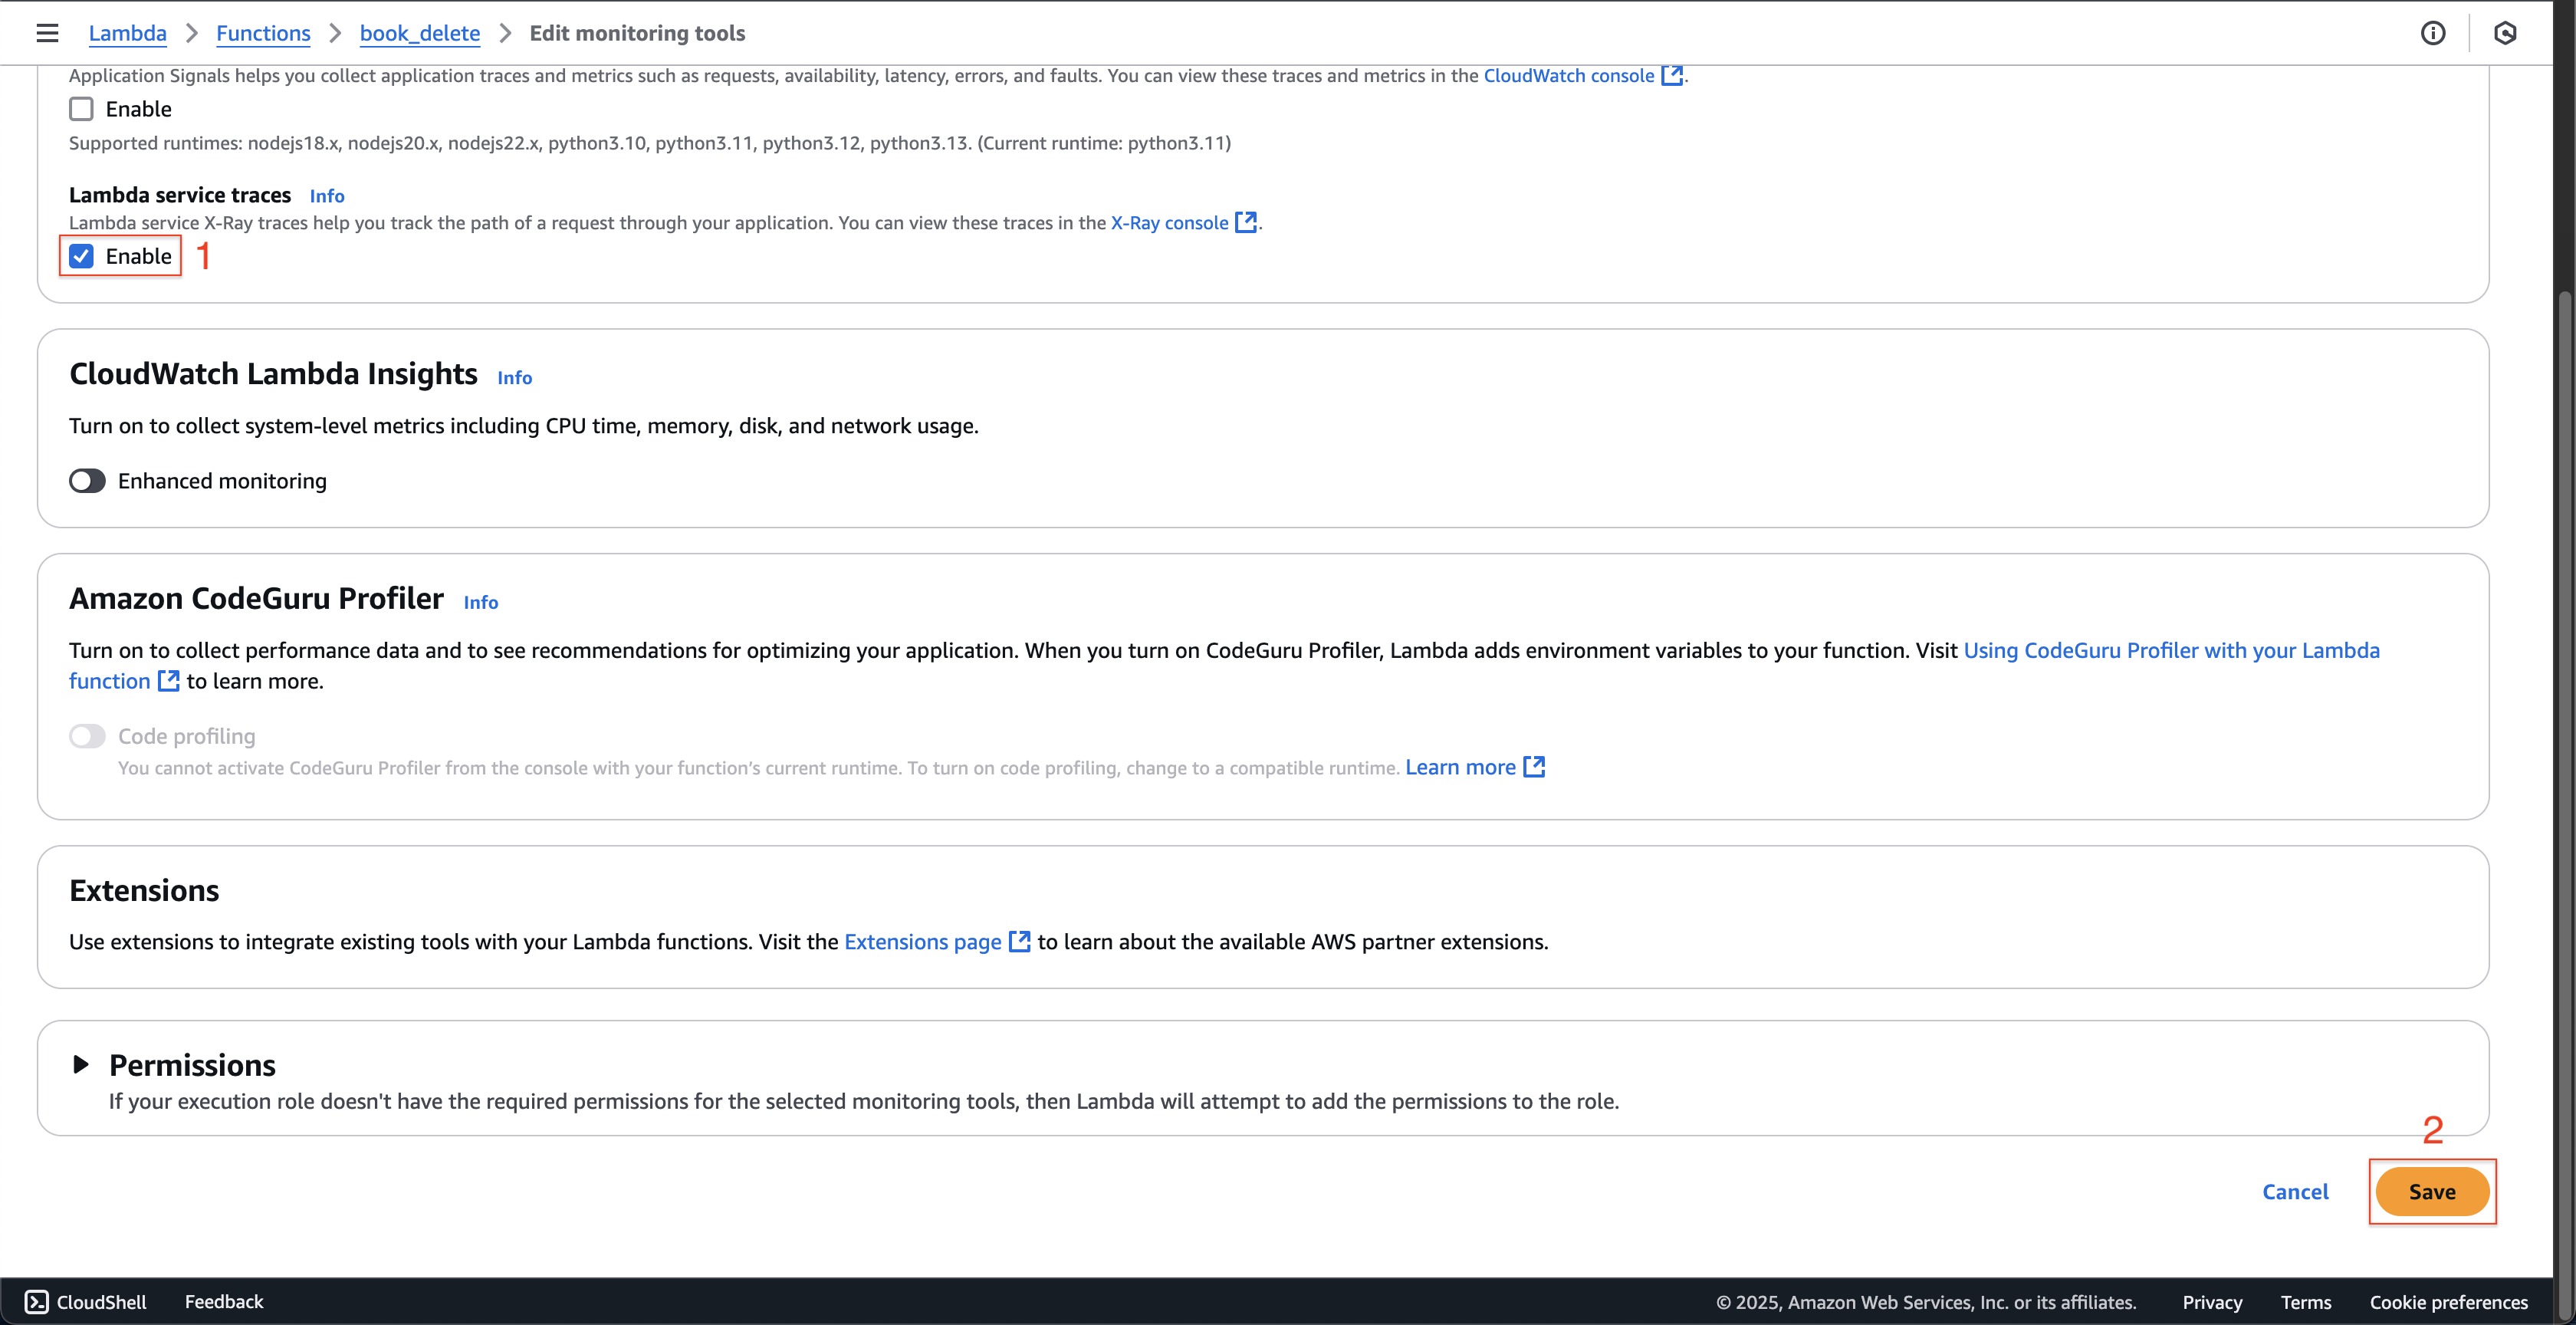
At Edit monitoring tools page.
- Check on the Enable at Lambda service traces.
- Click the Save button.
-
Open Postman to call api.
- Click + to add a new tab.
- Select DELETE method.
- Enter URL of the deleting API with book_id, for example is
2. - Click Send.
- After completing, the book with id
2is deleted.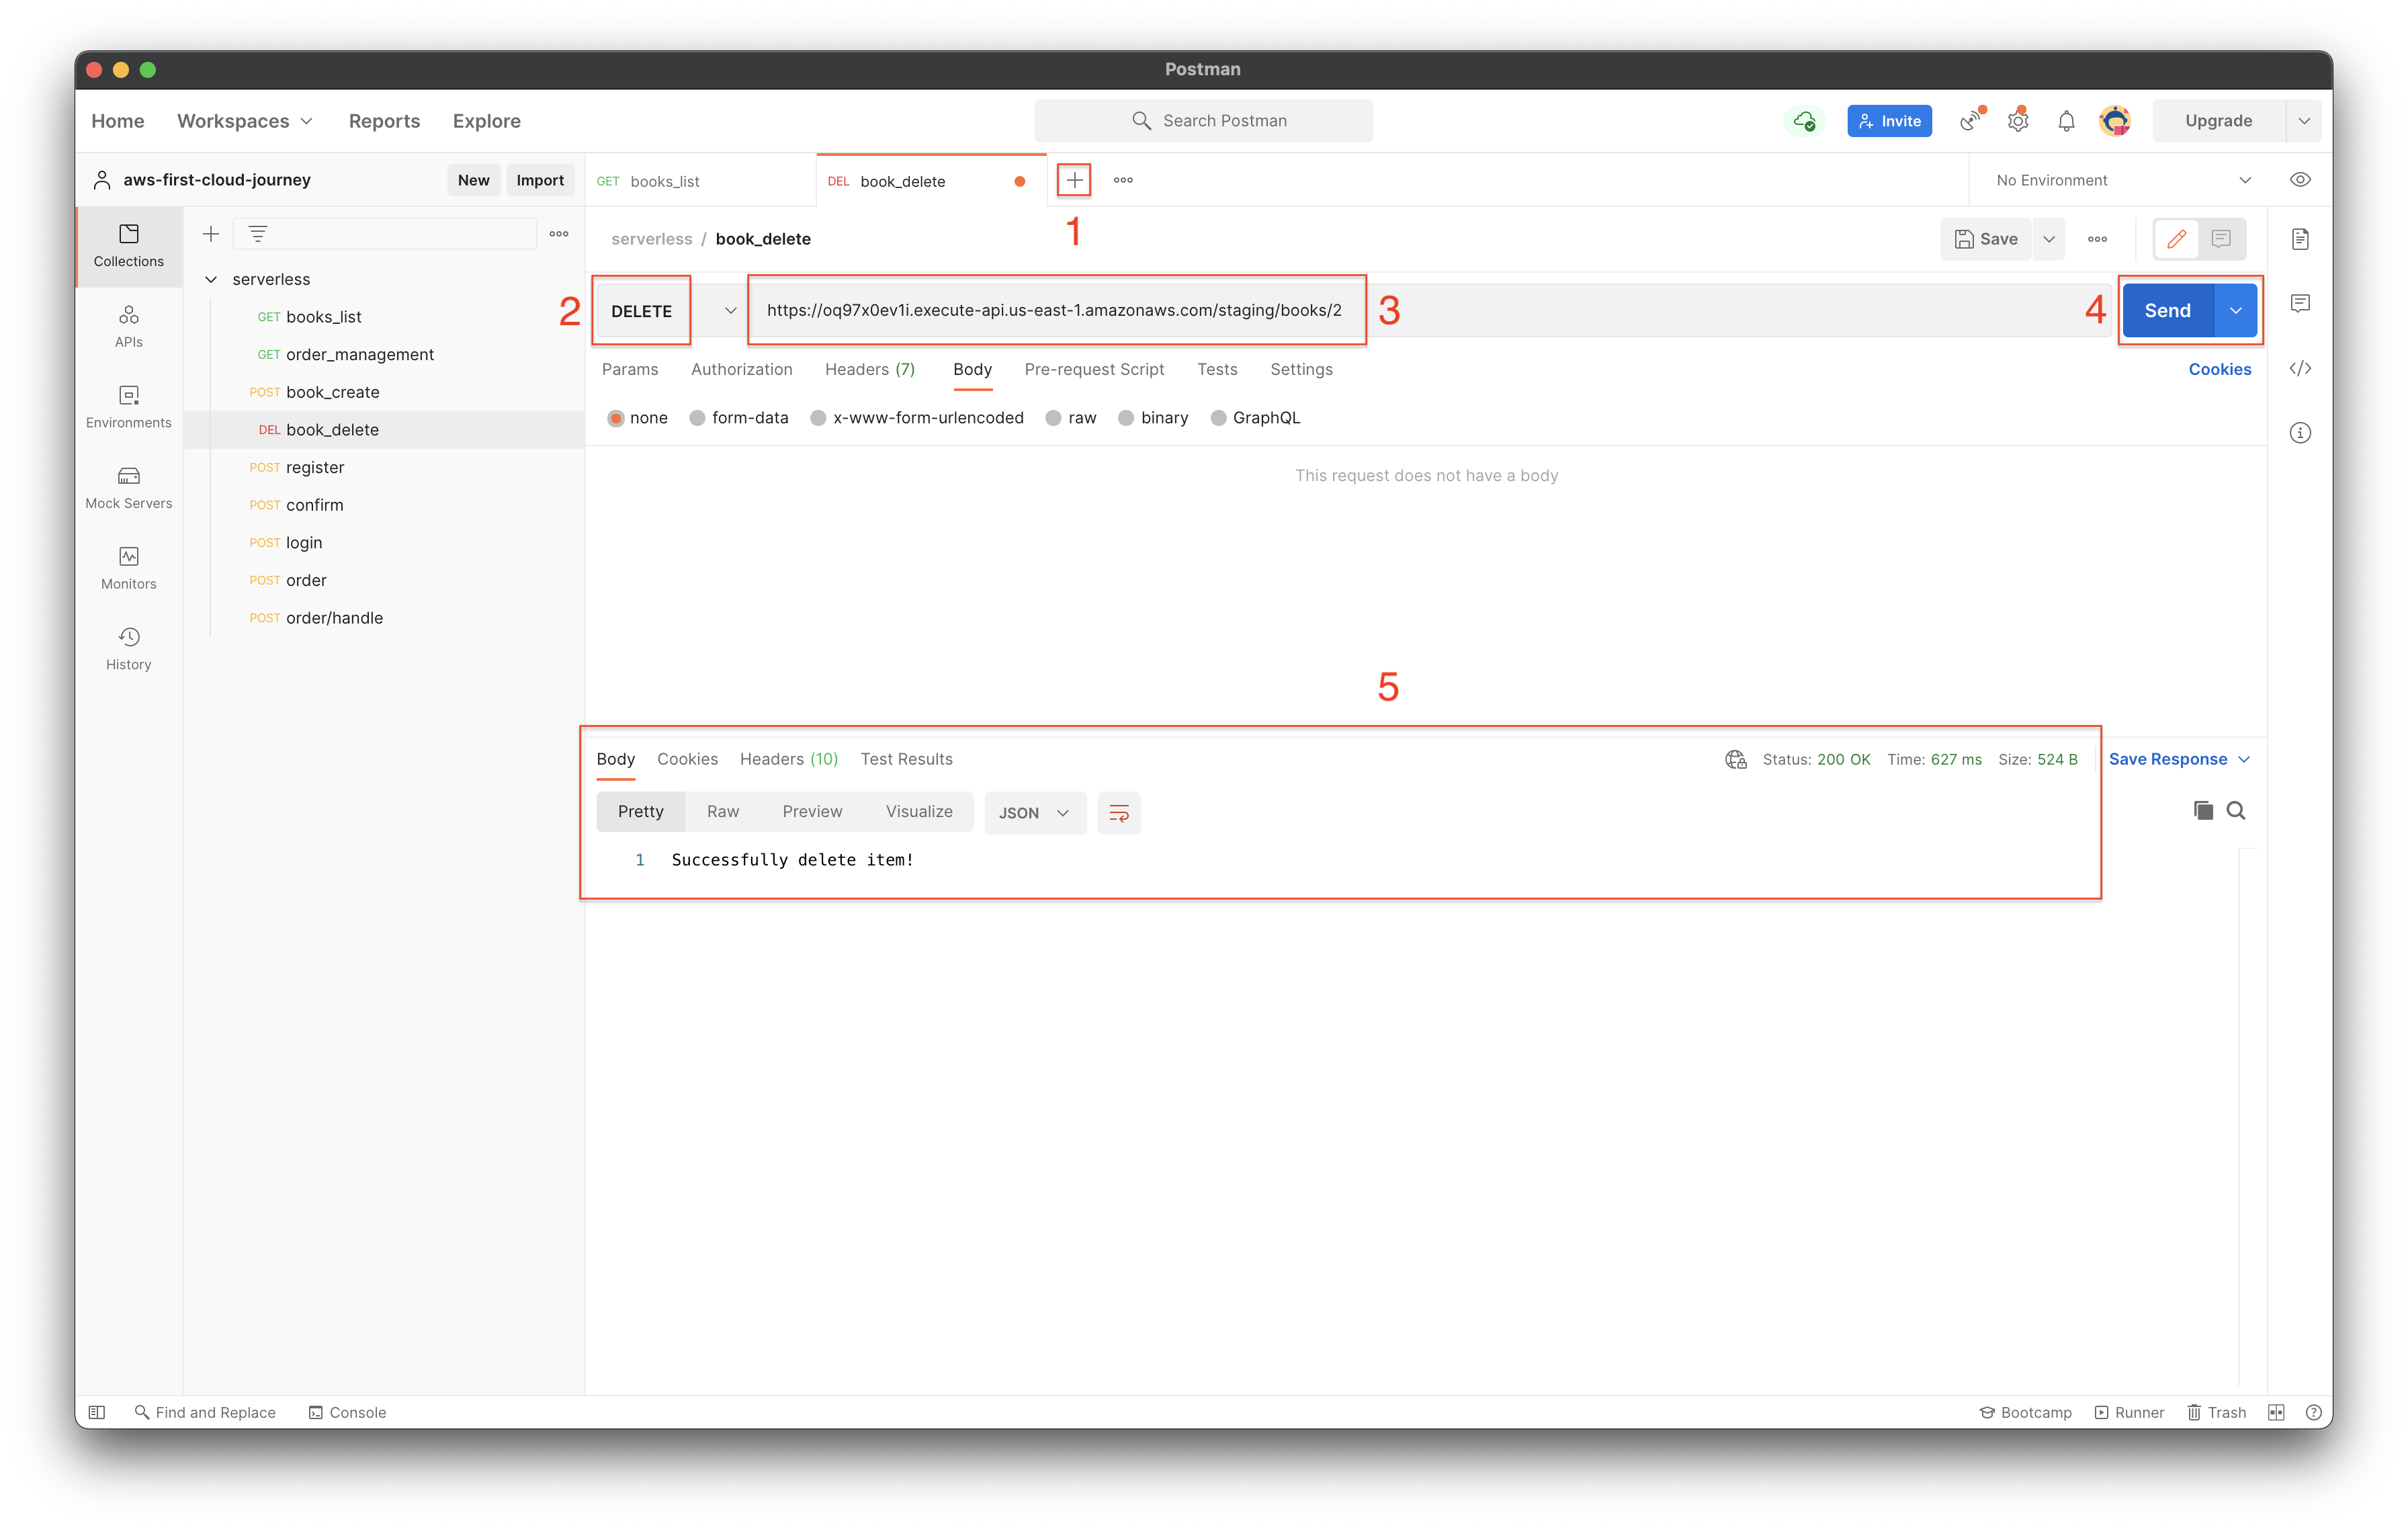
-
Back to book_delete page.
- Click the Monitor tab.
- Click the View X-Ray traces button.

-
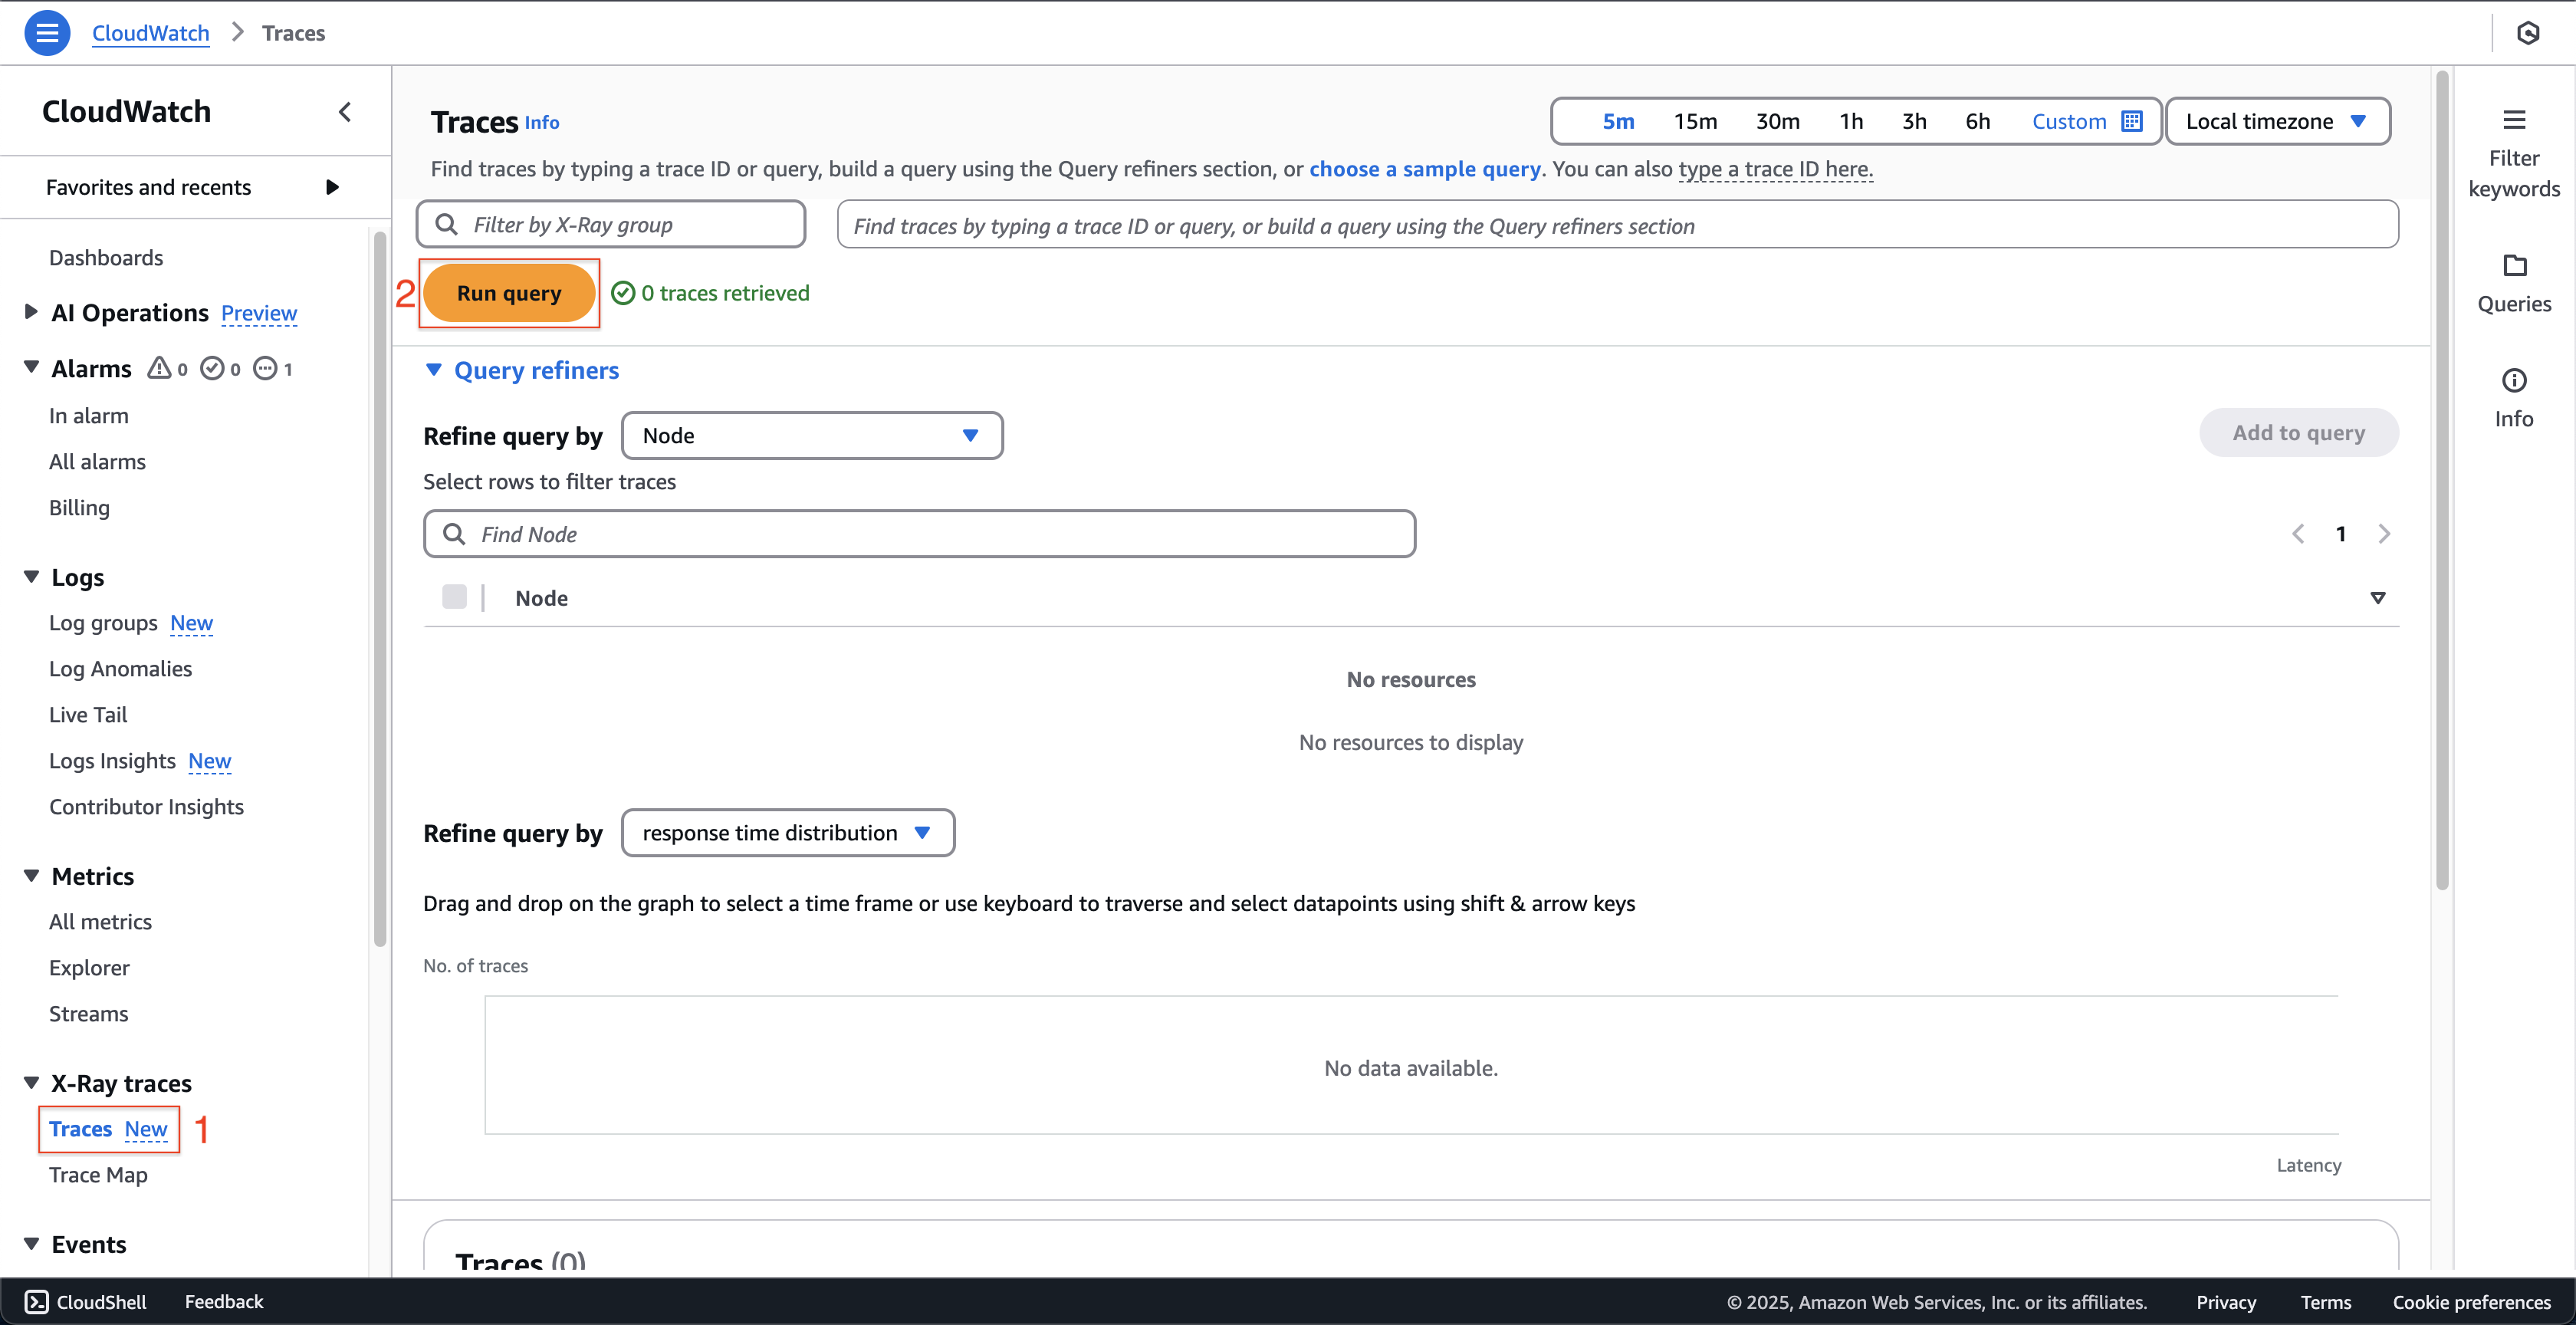
At CloudWatch page.
- Click the Traces on the left menu.
- Click the Run query button.
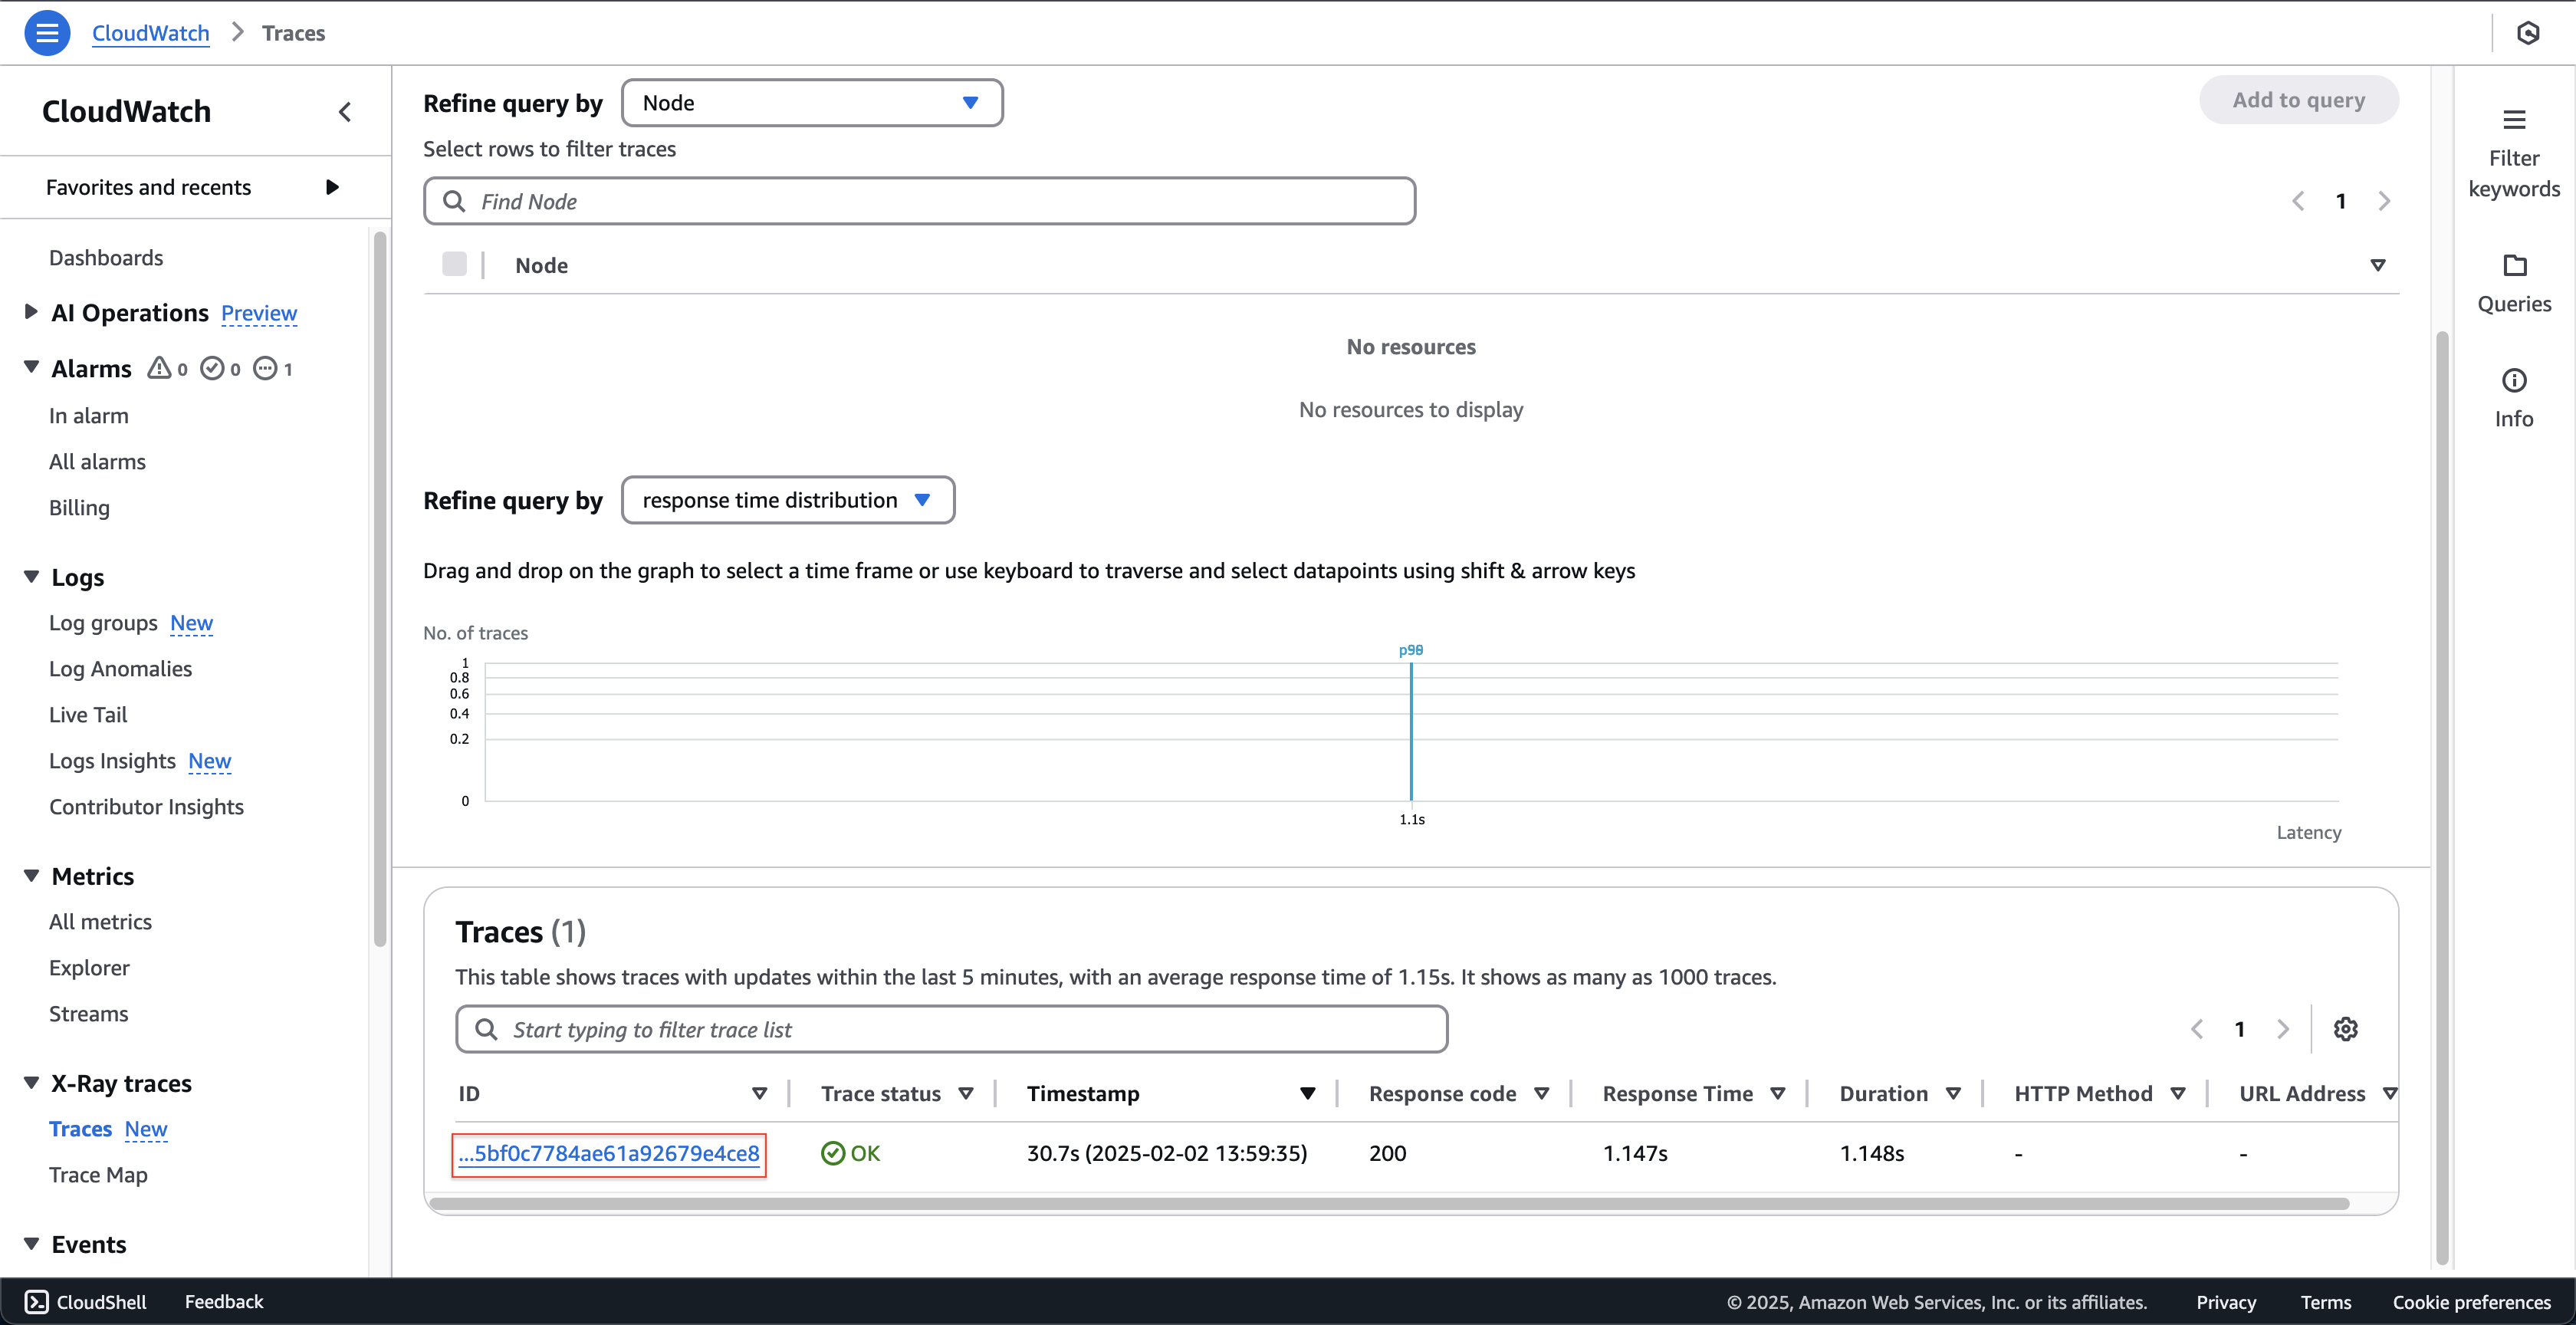
- Then, scroll down and select the current displaced trace with status OK.
-
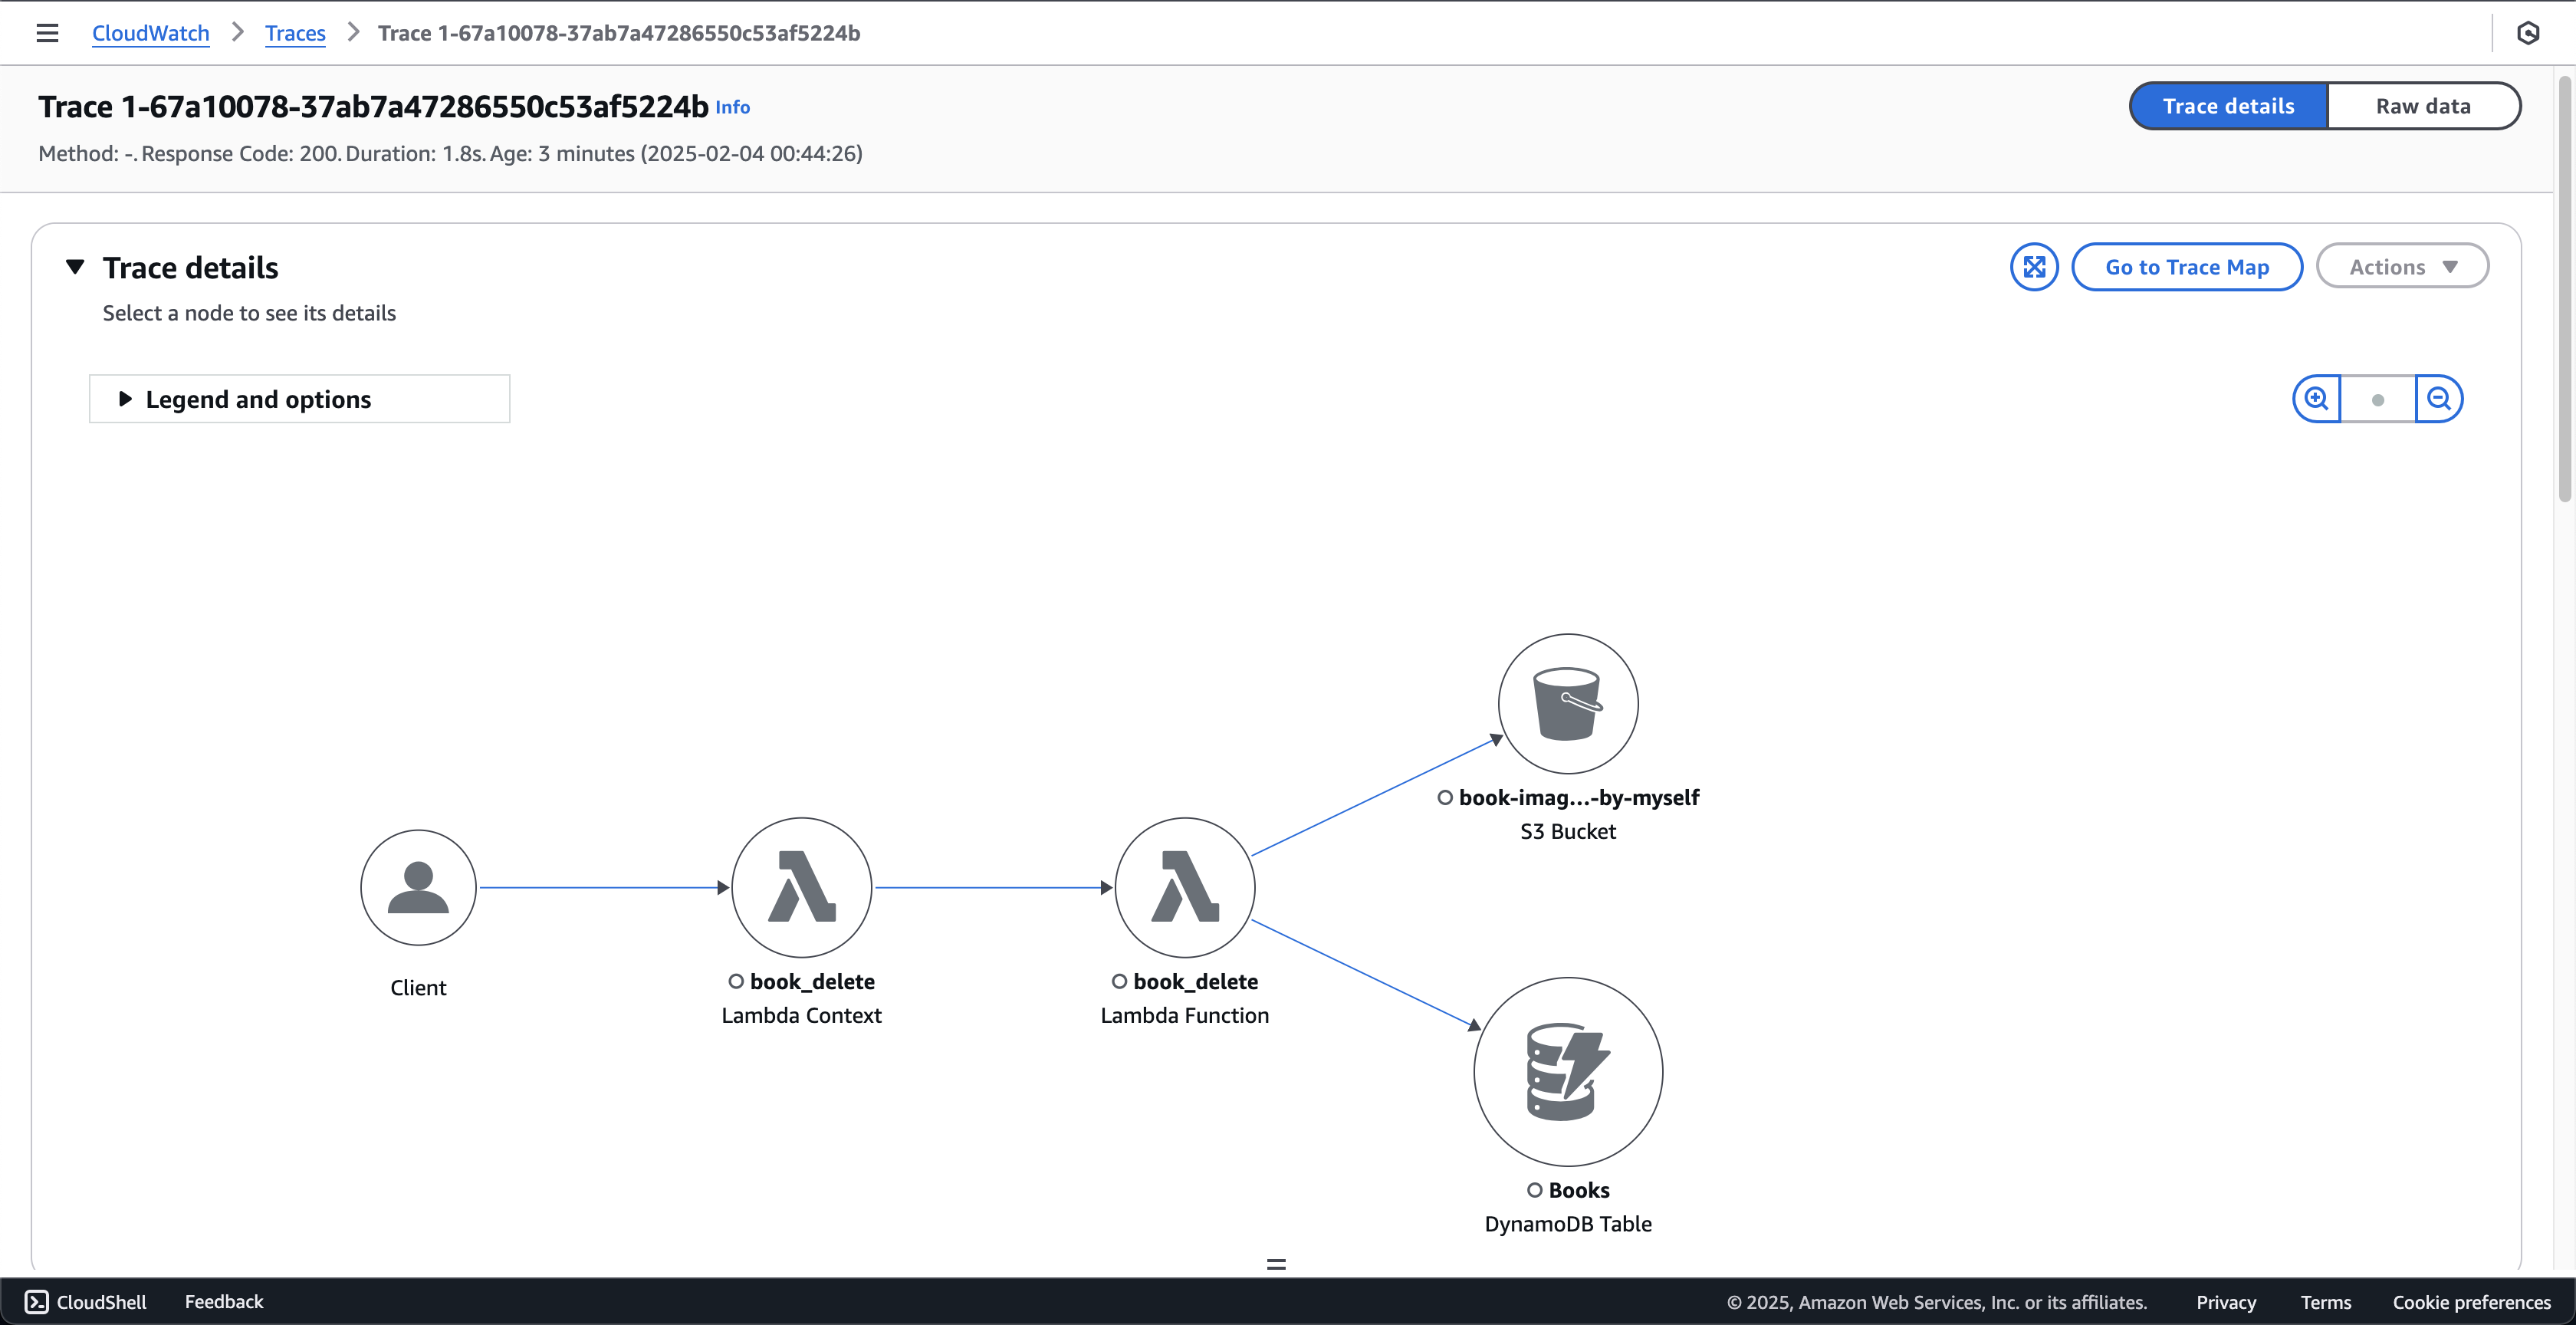
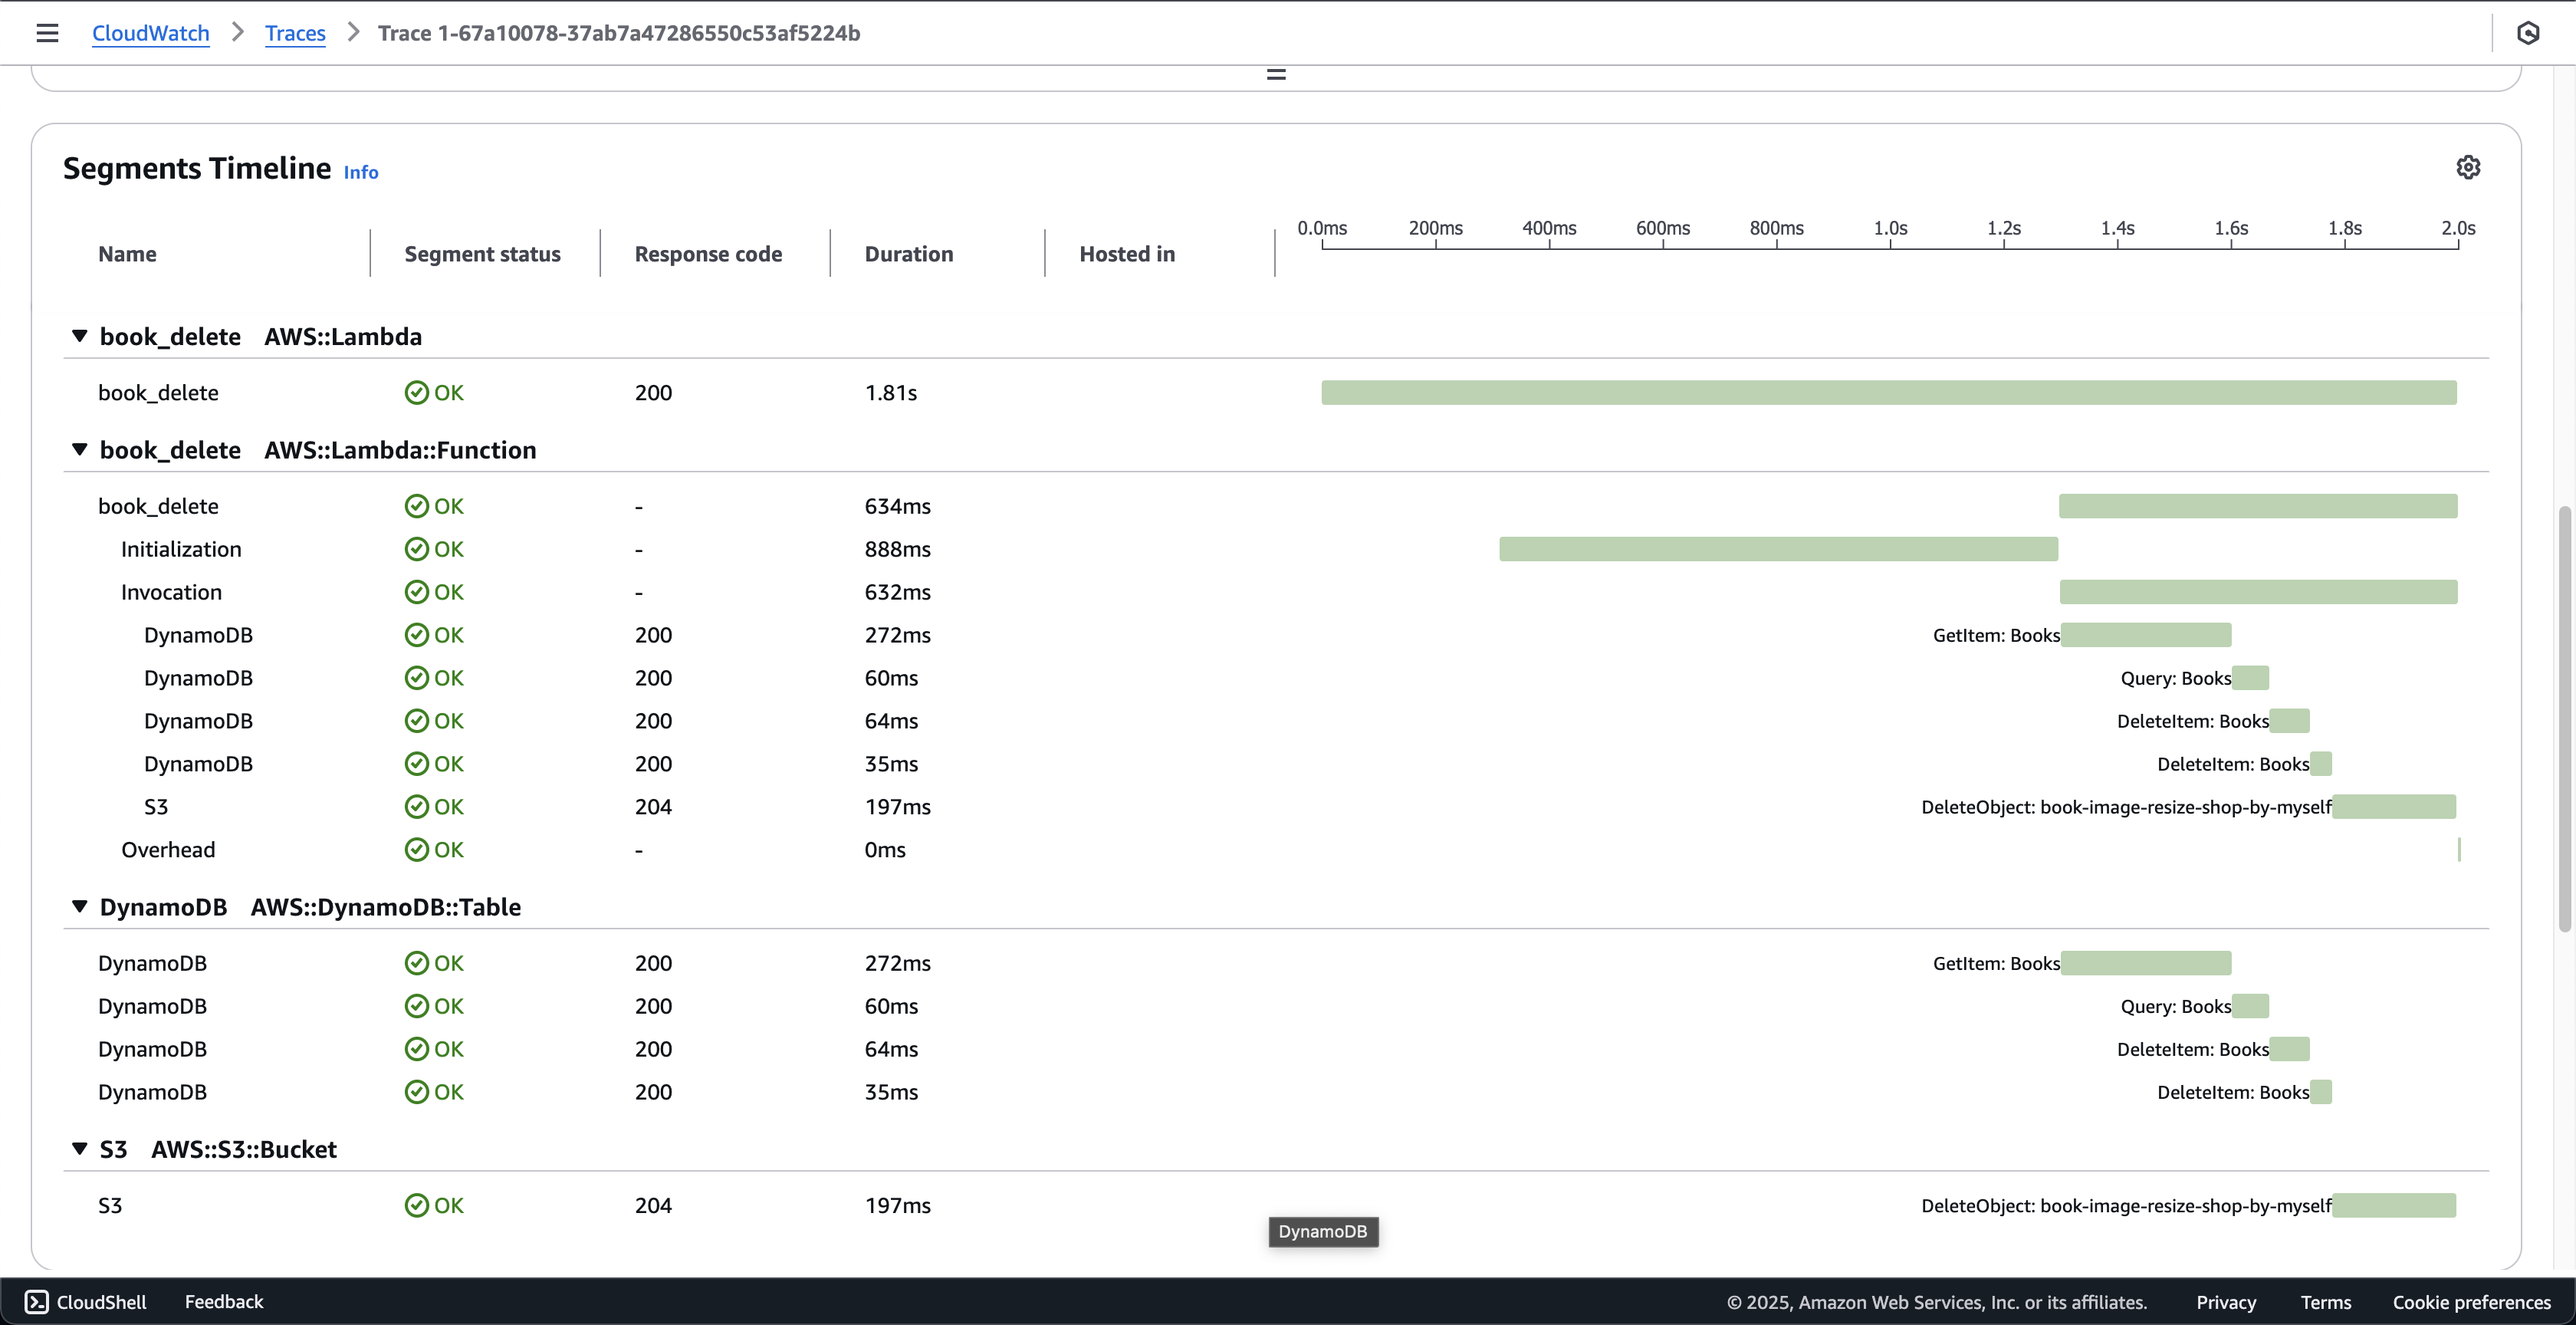
At Trace 1-… page. You can see the subsegment.
- Initialization subsegment: Represents the init phase of the Lambda execution environment lifecycle. During this phase, Lambda creates or opens an execution environment with configured resources, downloads the function code and all classes, runs the runtime, and initializes the function.
- Invocation subsegment: Represents the stage when Lambda calls the function handler. This starts with the runtime and registers the extension and it ends when the runtime is ready to send a response.
- Overhead subsegment: Represents the period that occurs between the time that the runtime sends the response and signal for the next call. During this time, the runtime finishes all tasks associated with an invocation and prepares to freeze the sandbox.

-
Go to the root directory of fcj-book-store-sam-ws8 project. Open the fcj-book-store-sam-ws8/fcj-book-shop/book_delete directory.
-
Create a file called
requirements.txtwith the below content.aws_xray_sdk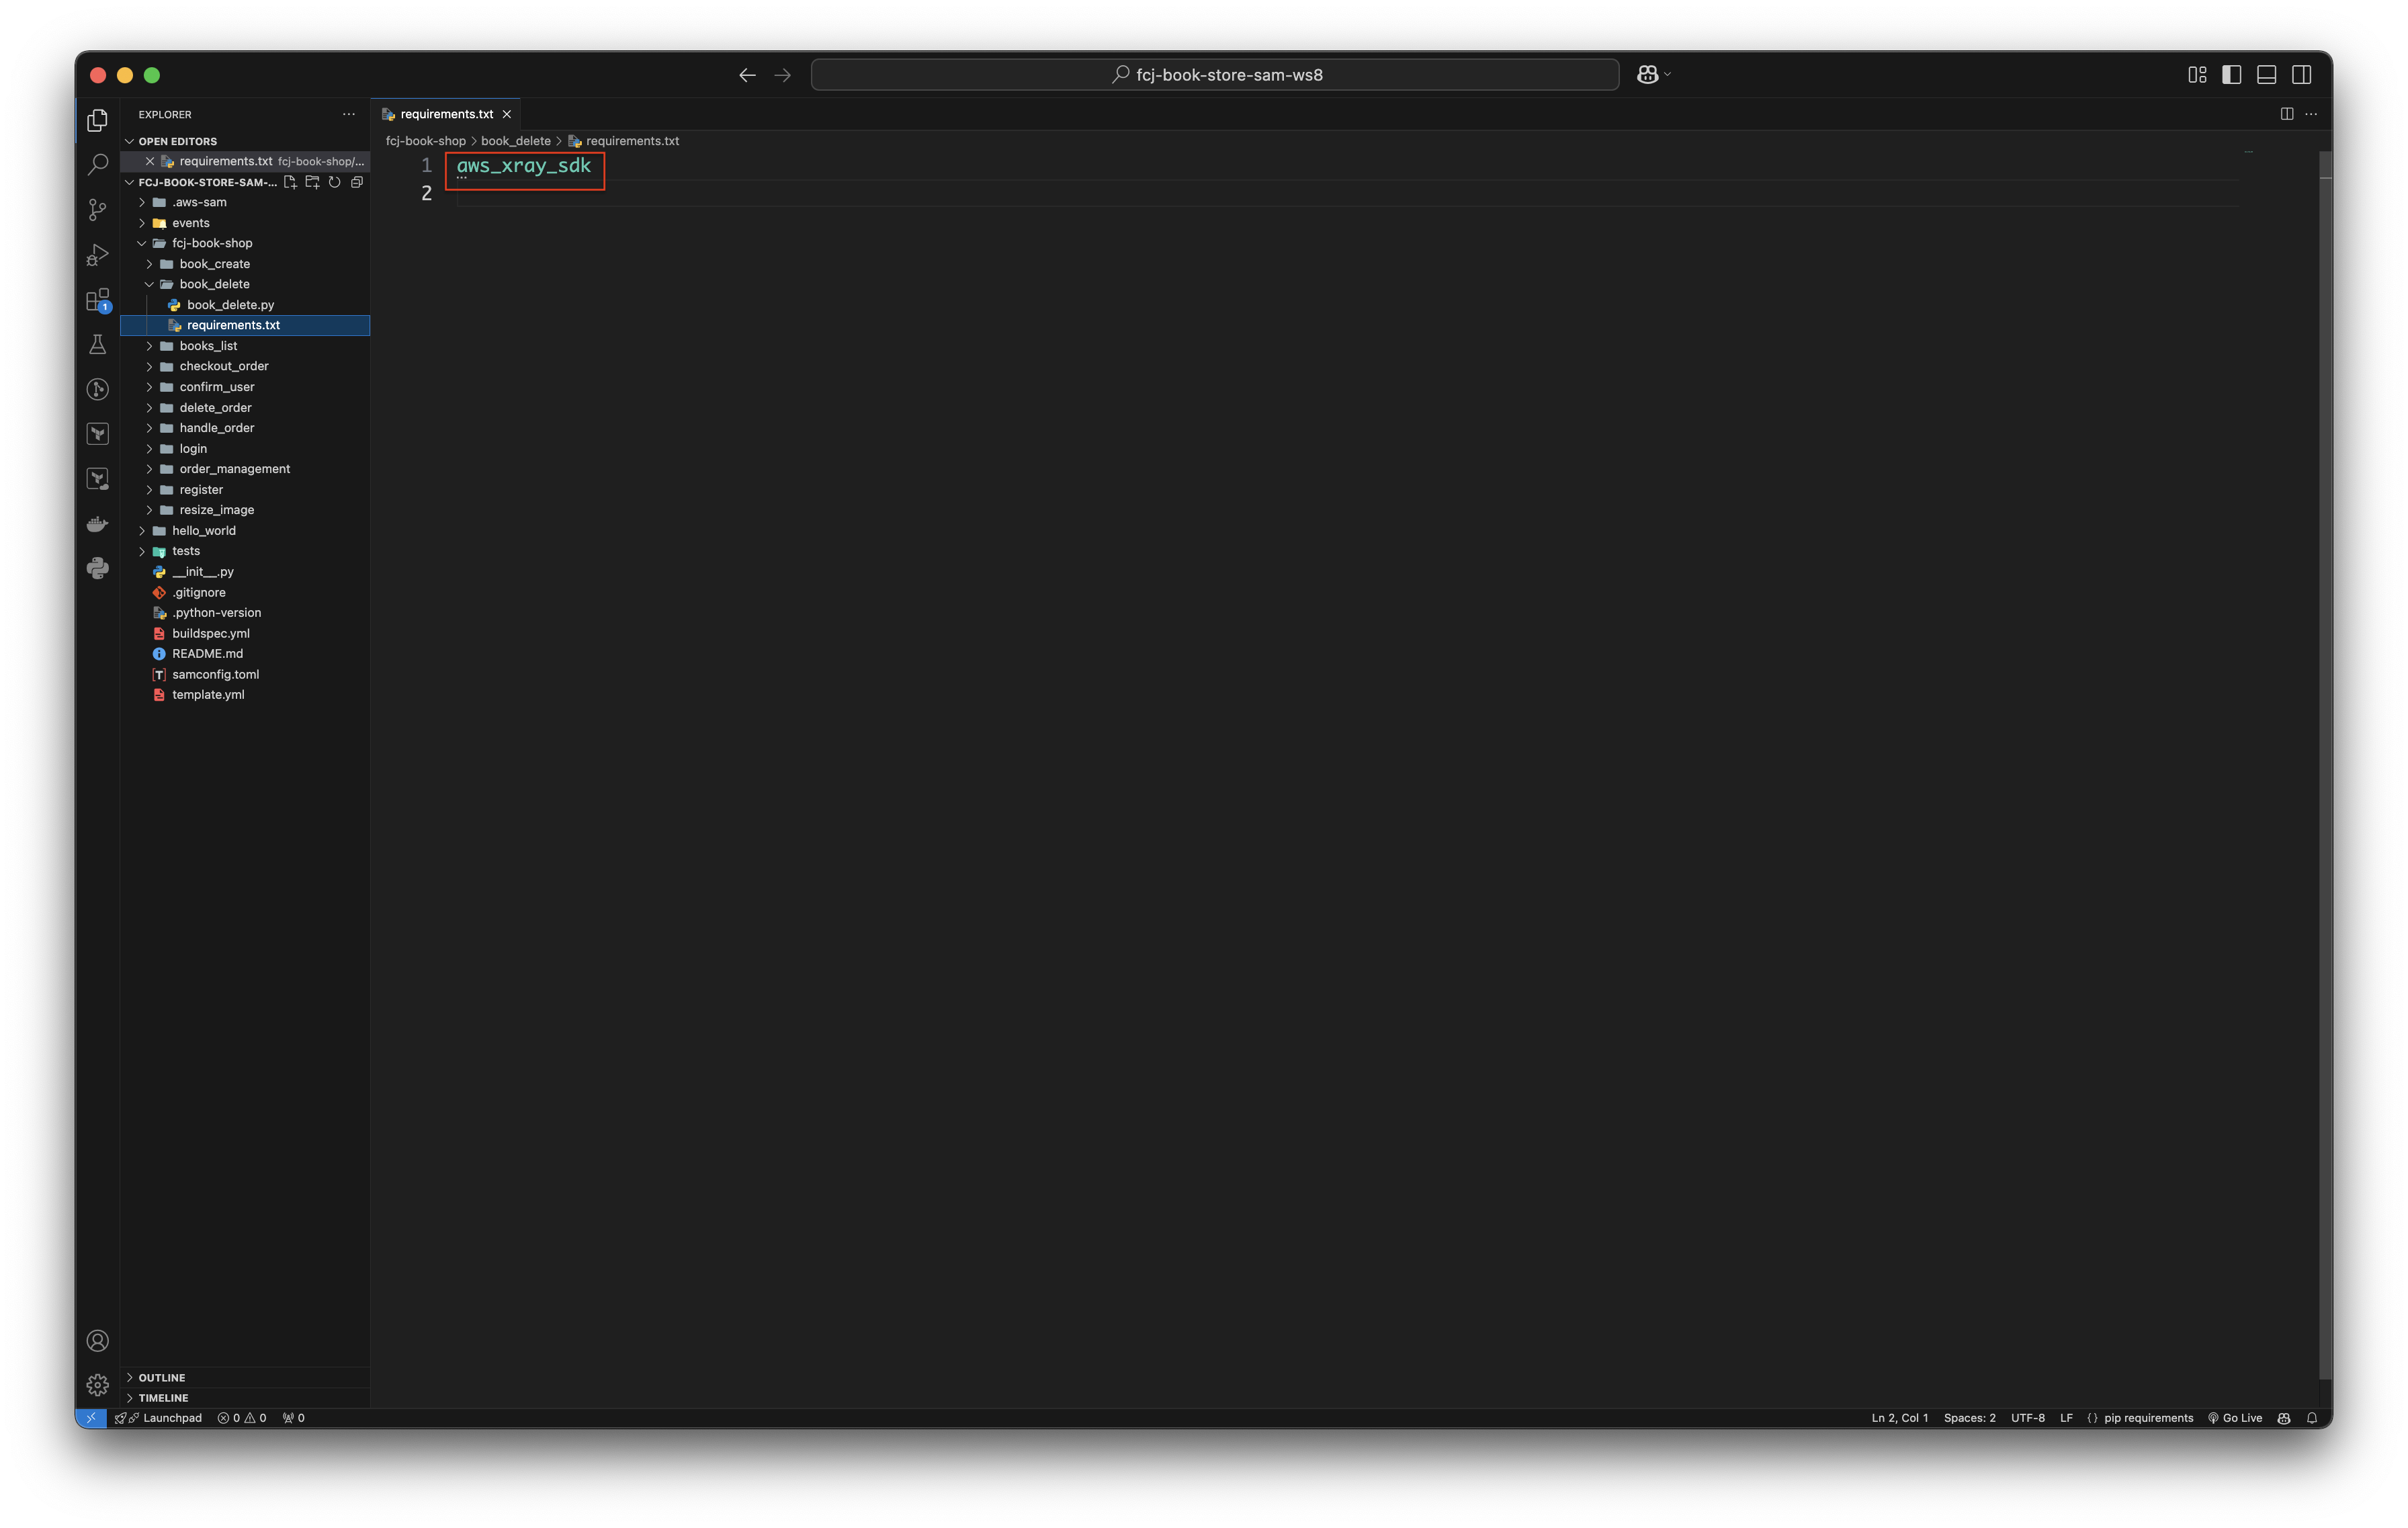
-
Open the fcj-book-store-sam-ws8/fcj-book-shop/book_delete/book_delete.py and copy the below content to that file.
from aws_xray_sdk.core import patch_all

patch_all()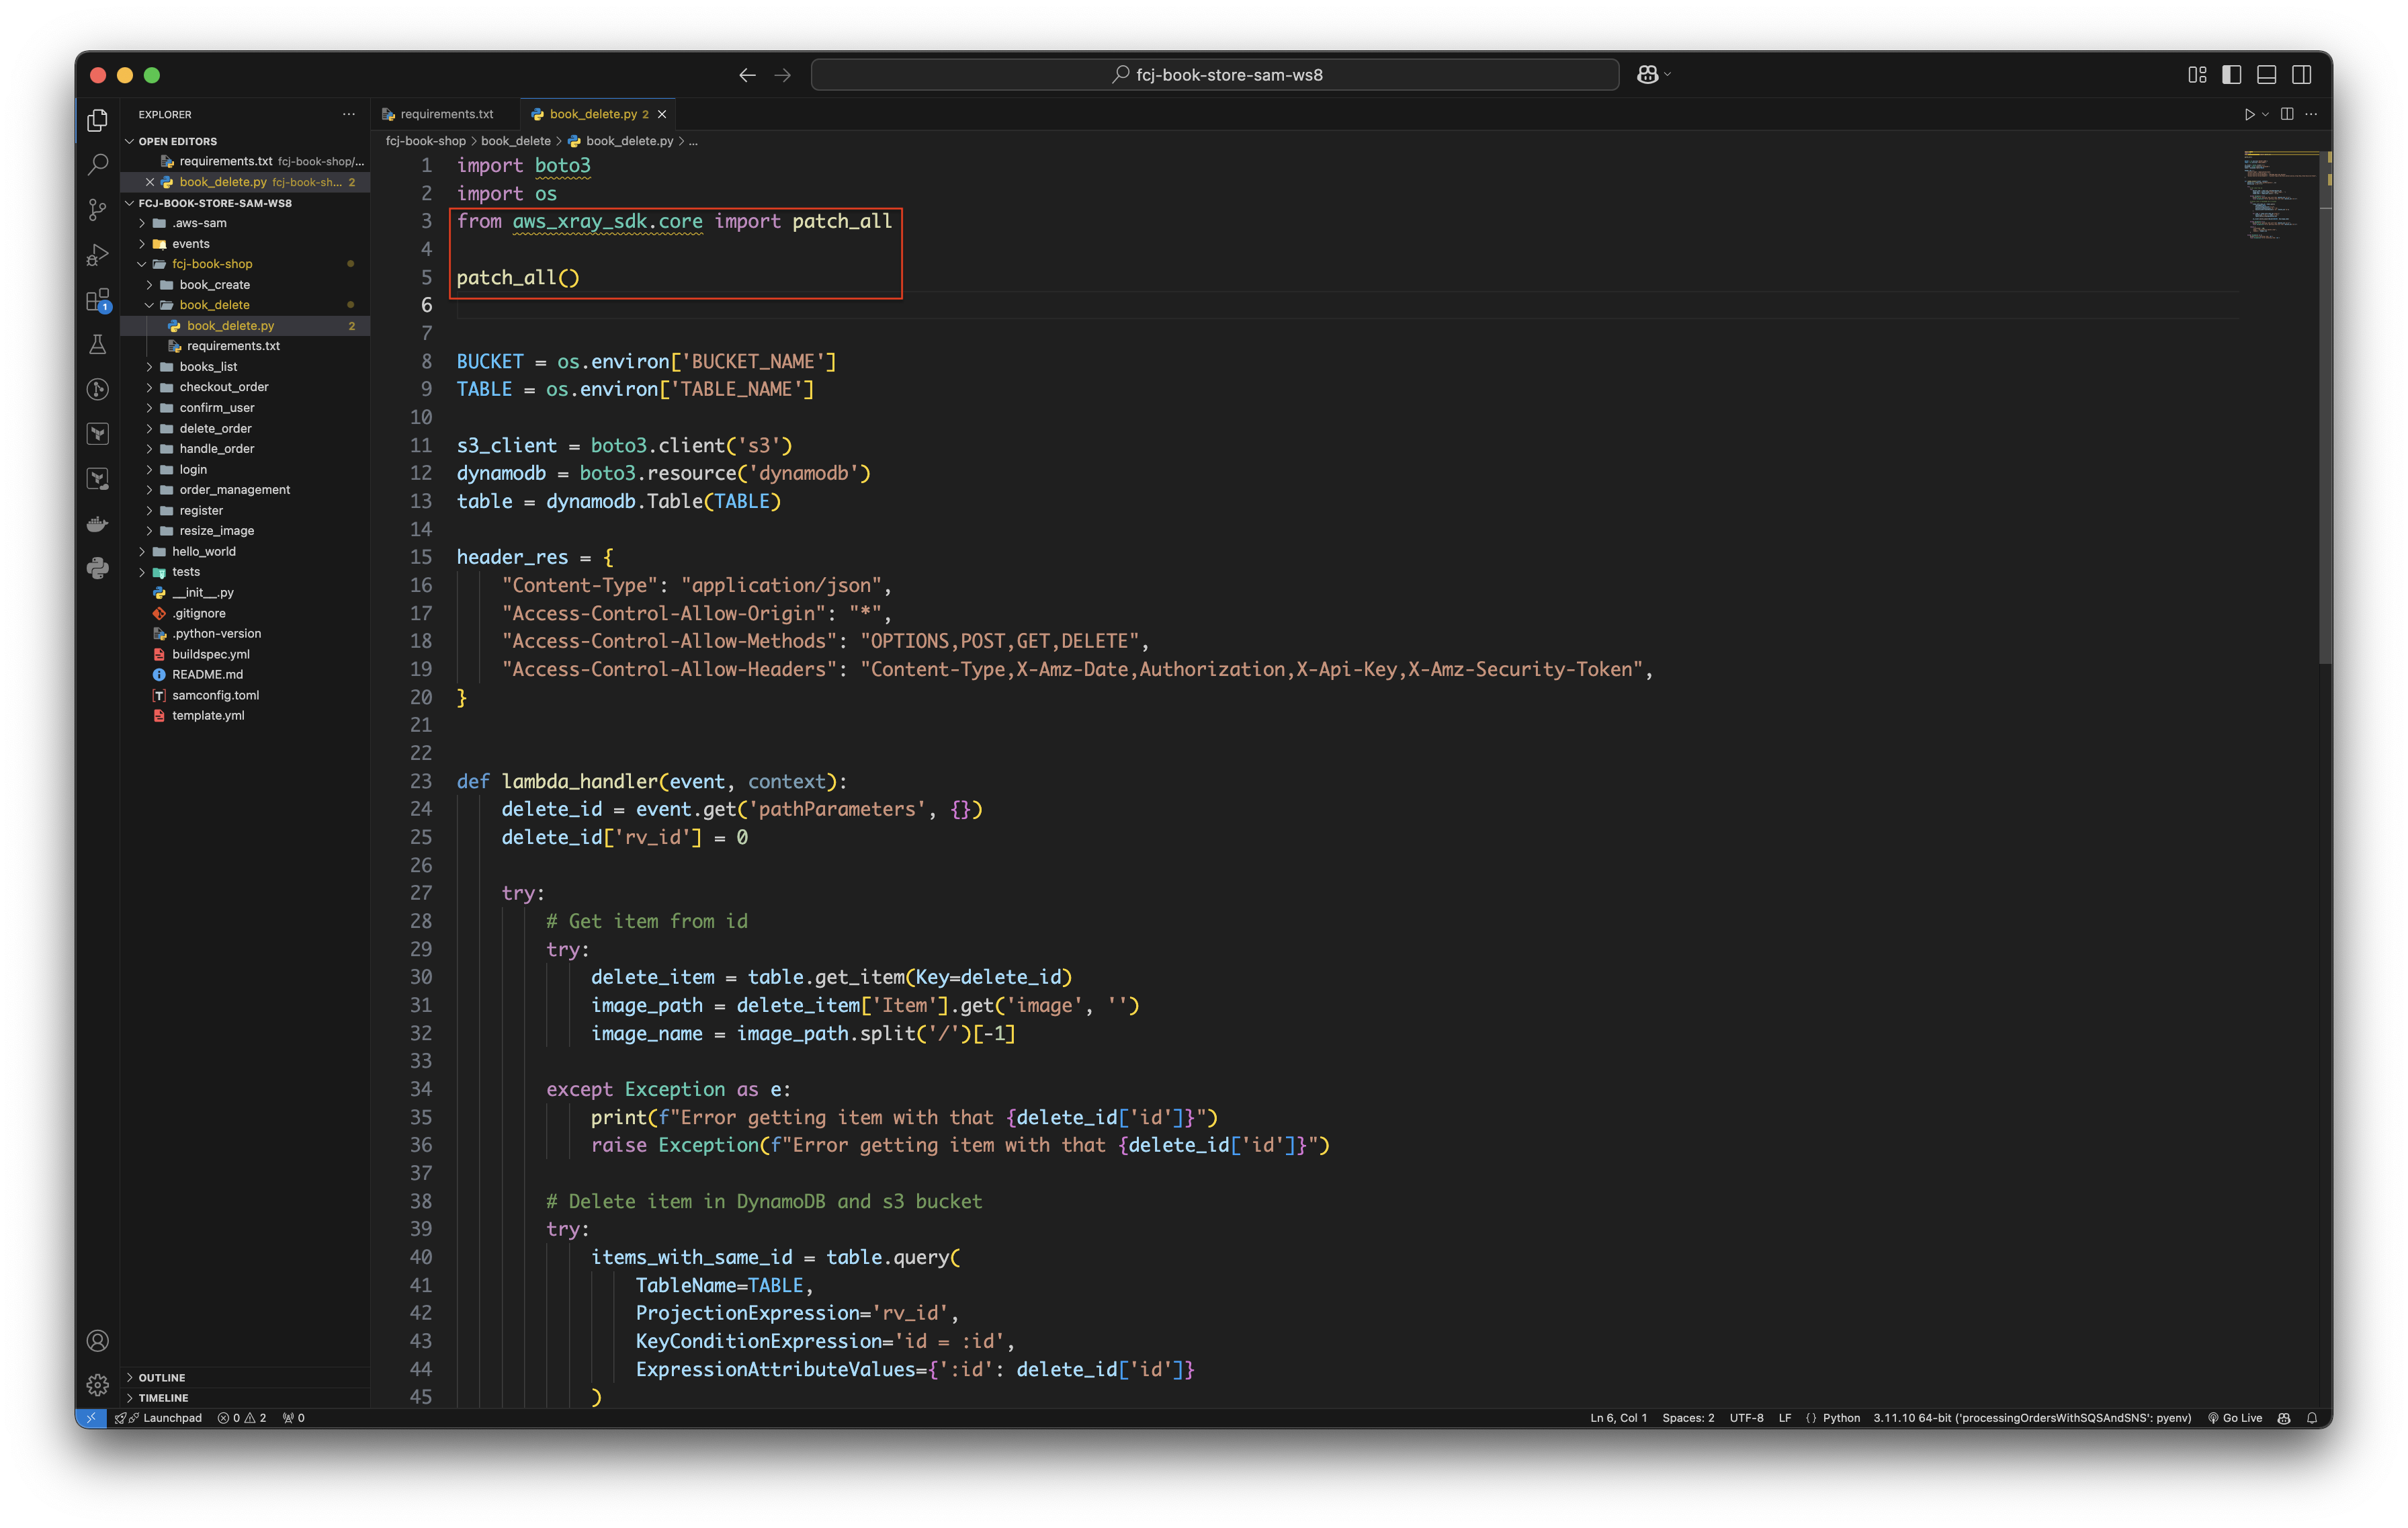
-
Open your terminal and run the below commands at the root directory of fcj-book-store-sam-ws8 project.
sam build
sam validate
sam deploy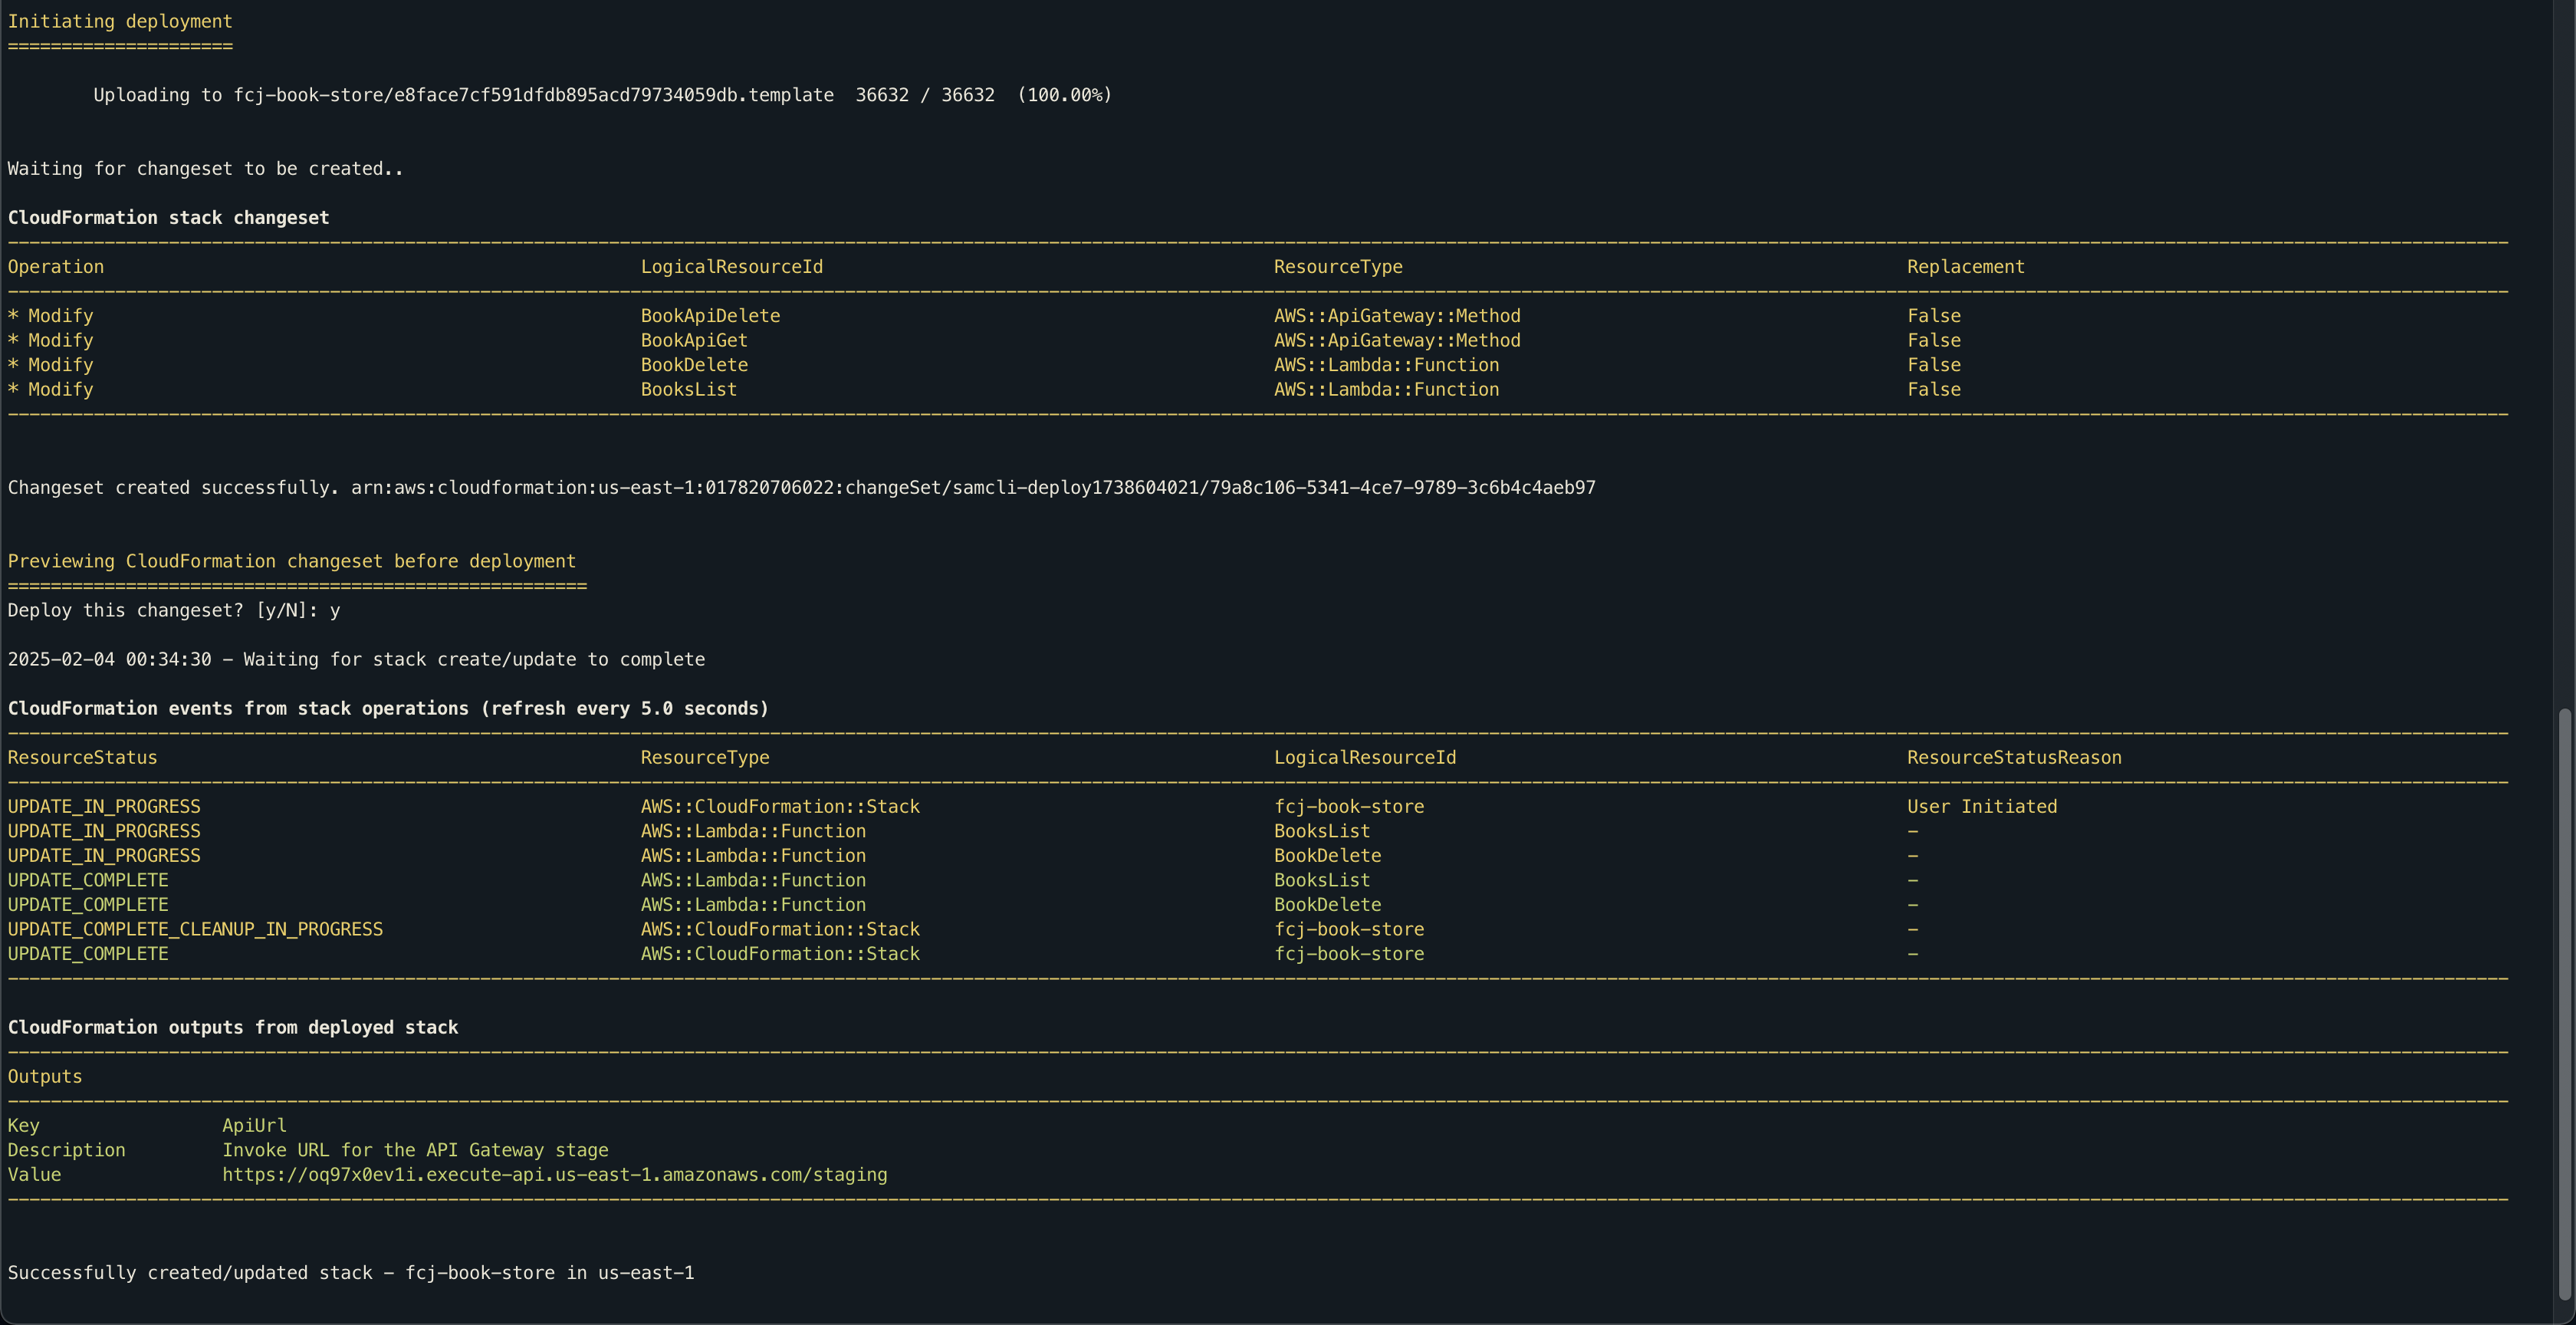
-
-
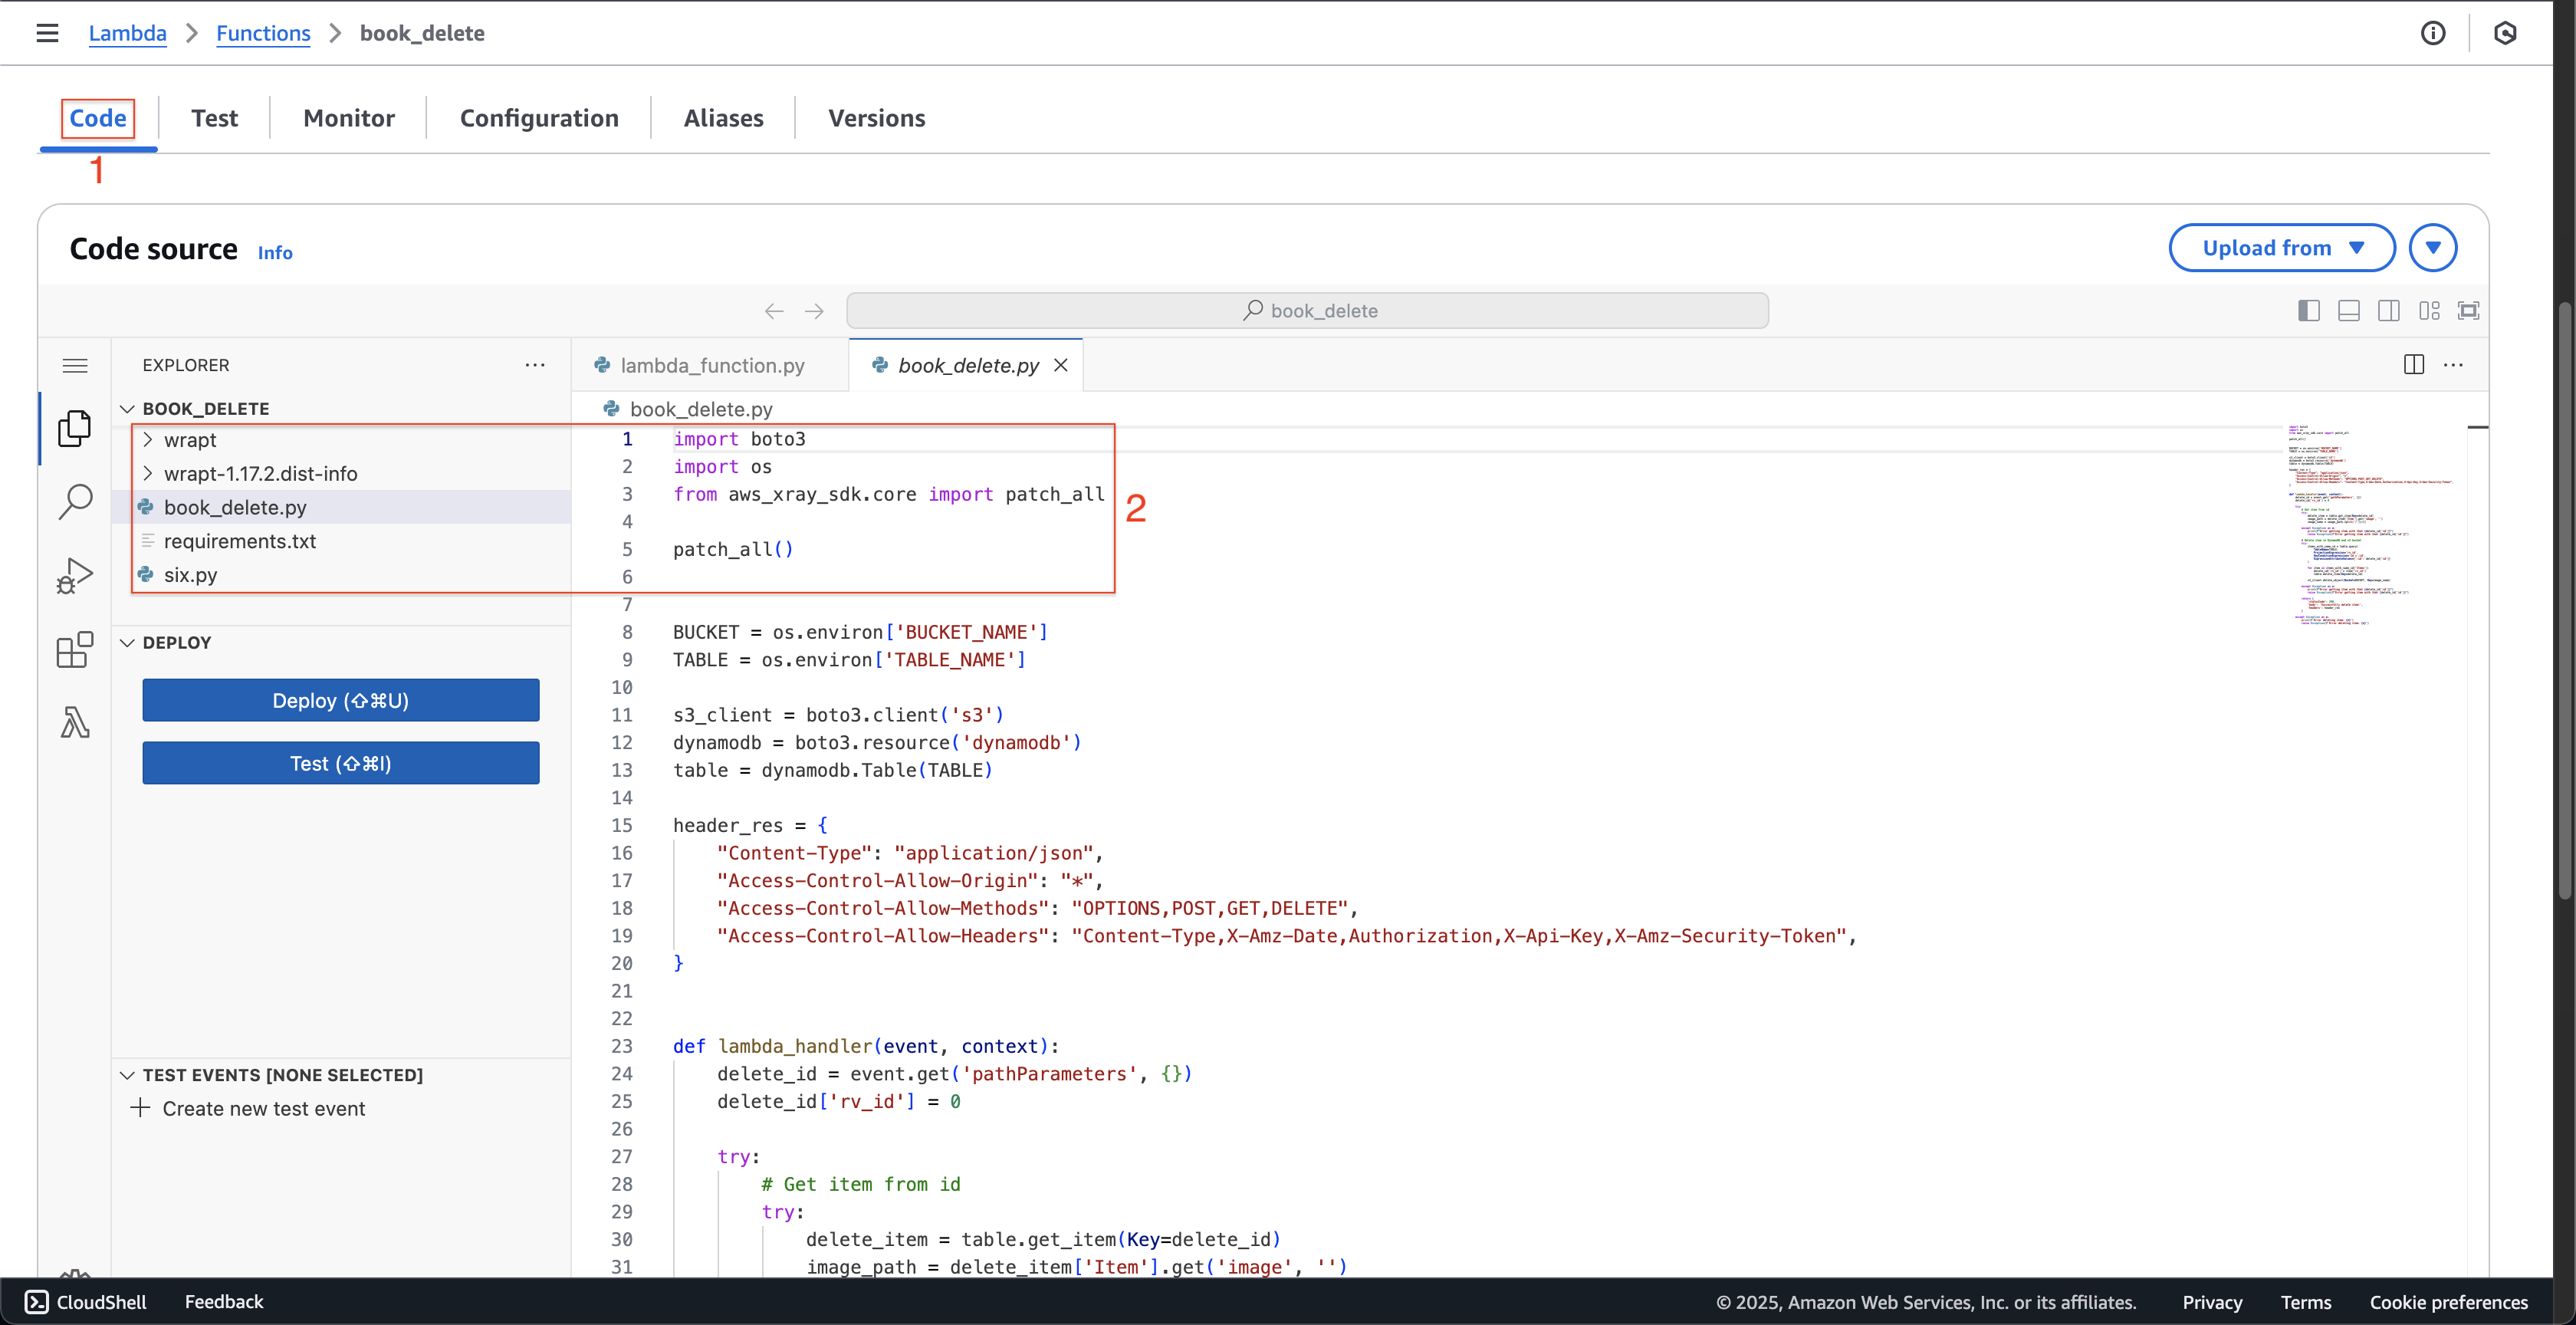
Back to book_delete page.
- Click the Code tab.
- Check if the book_delete function is updated.
-
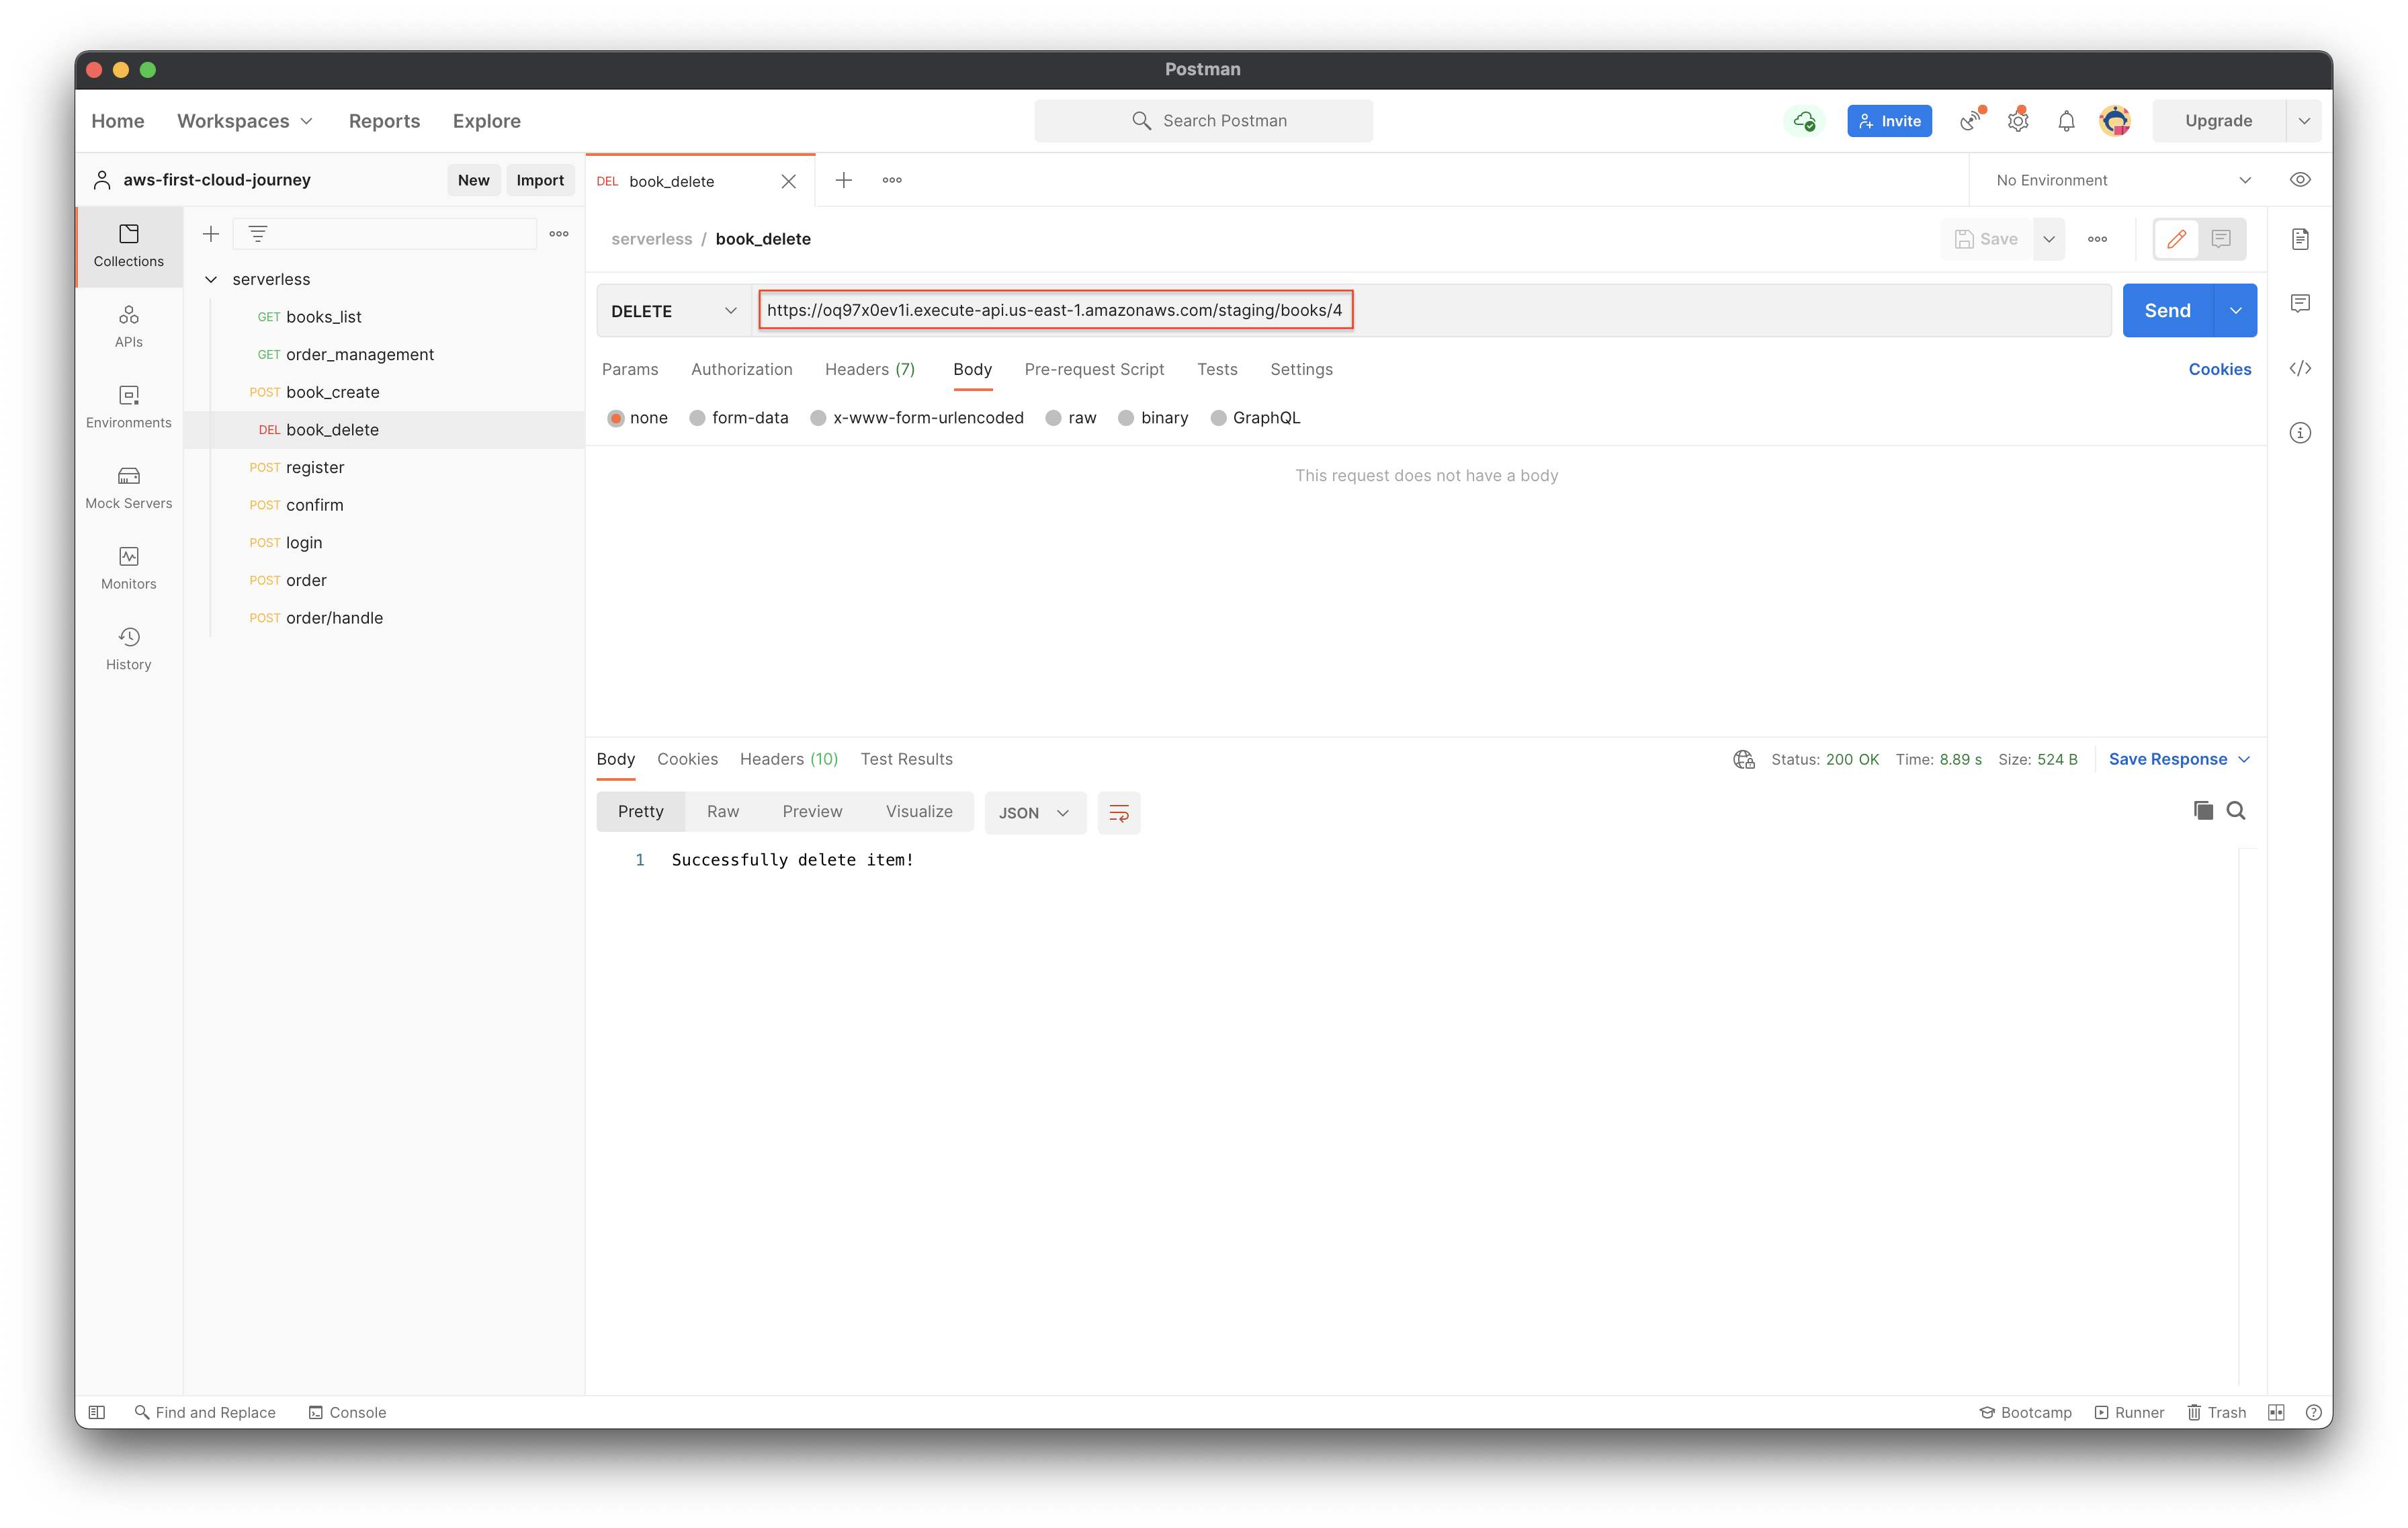
Open Postman to recall the DELETE api with the id
4.
-
Back to CloudWatch page.
- Click the Traces on the left menu.
- Click the Run query button.

- Then, scroll down and select the current displaced trace with status OK.

-
At Trace 1-… page. You can see the more specific information than in the previous trace.
