Creating Alerts with CloudWatch Alarm
-
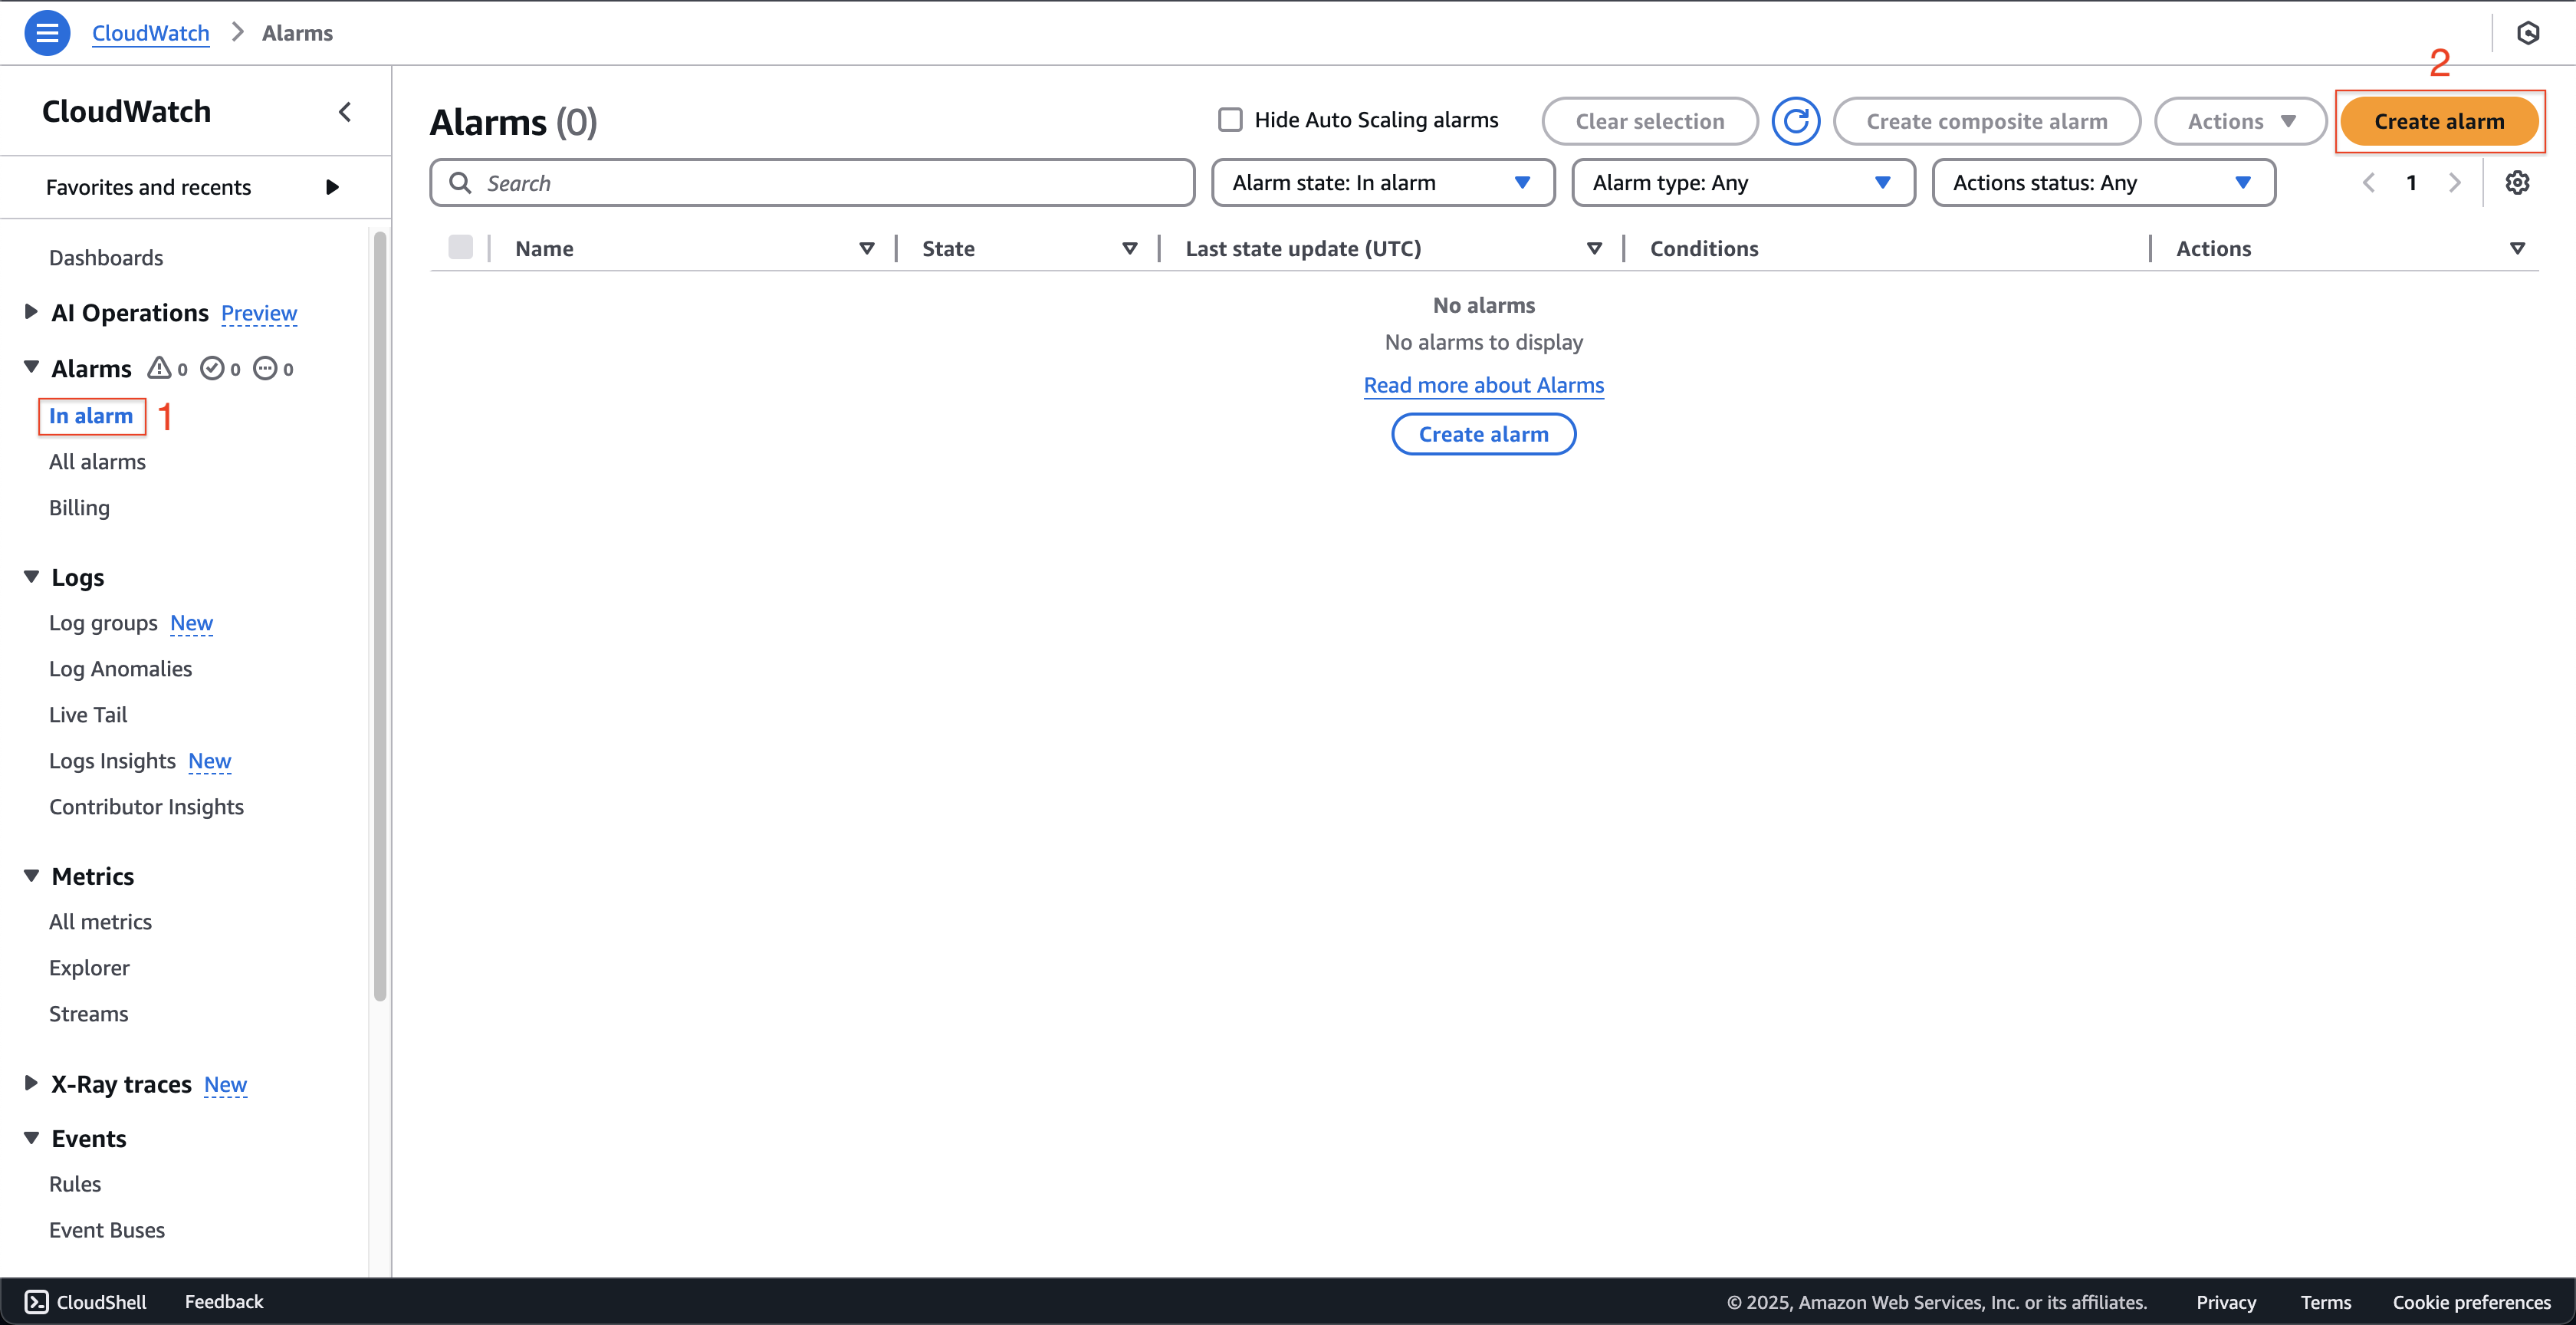
Open AWS CloudWatch console.
- Click the In alarm on the left menu.
- Click the Create alarm button.
-
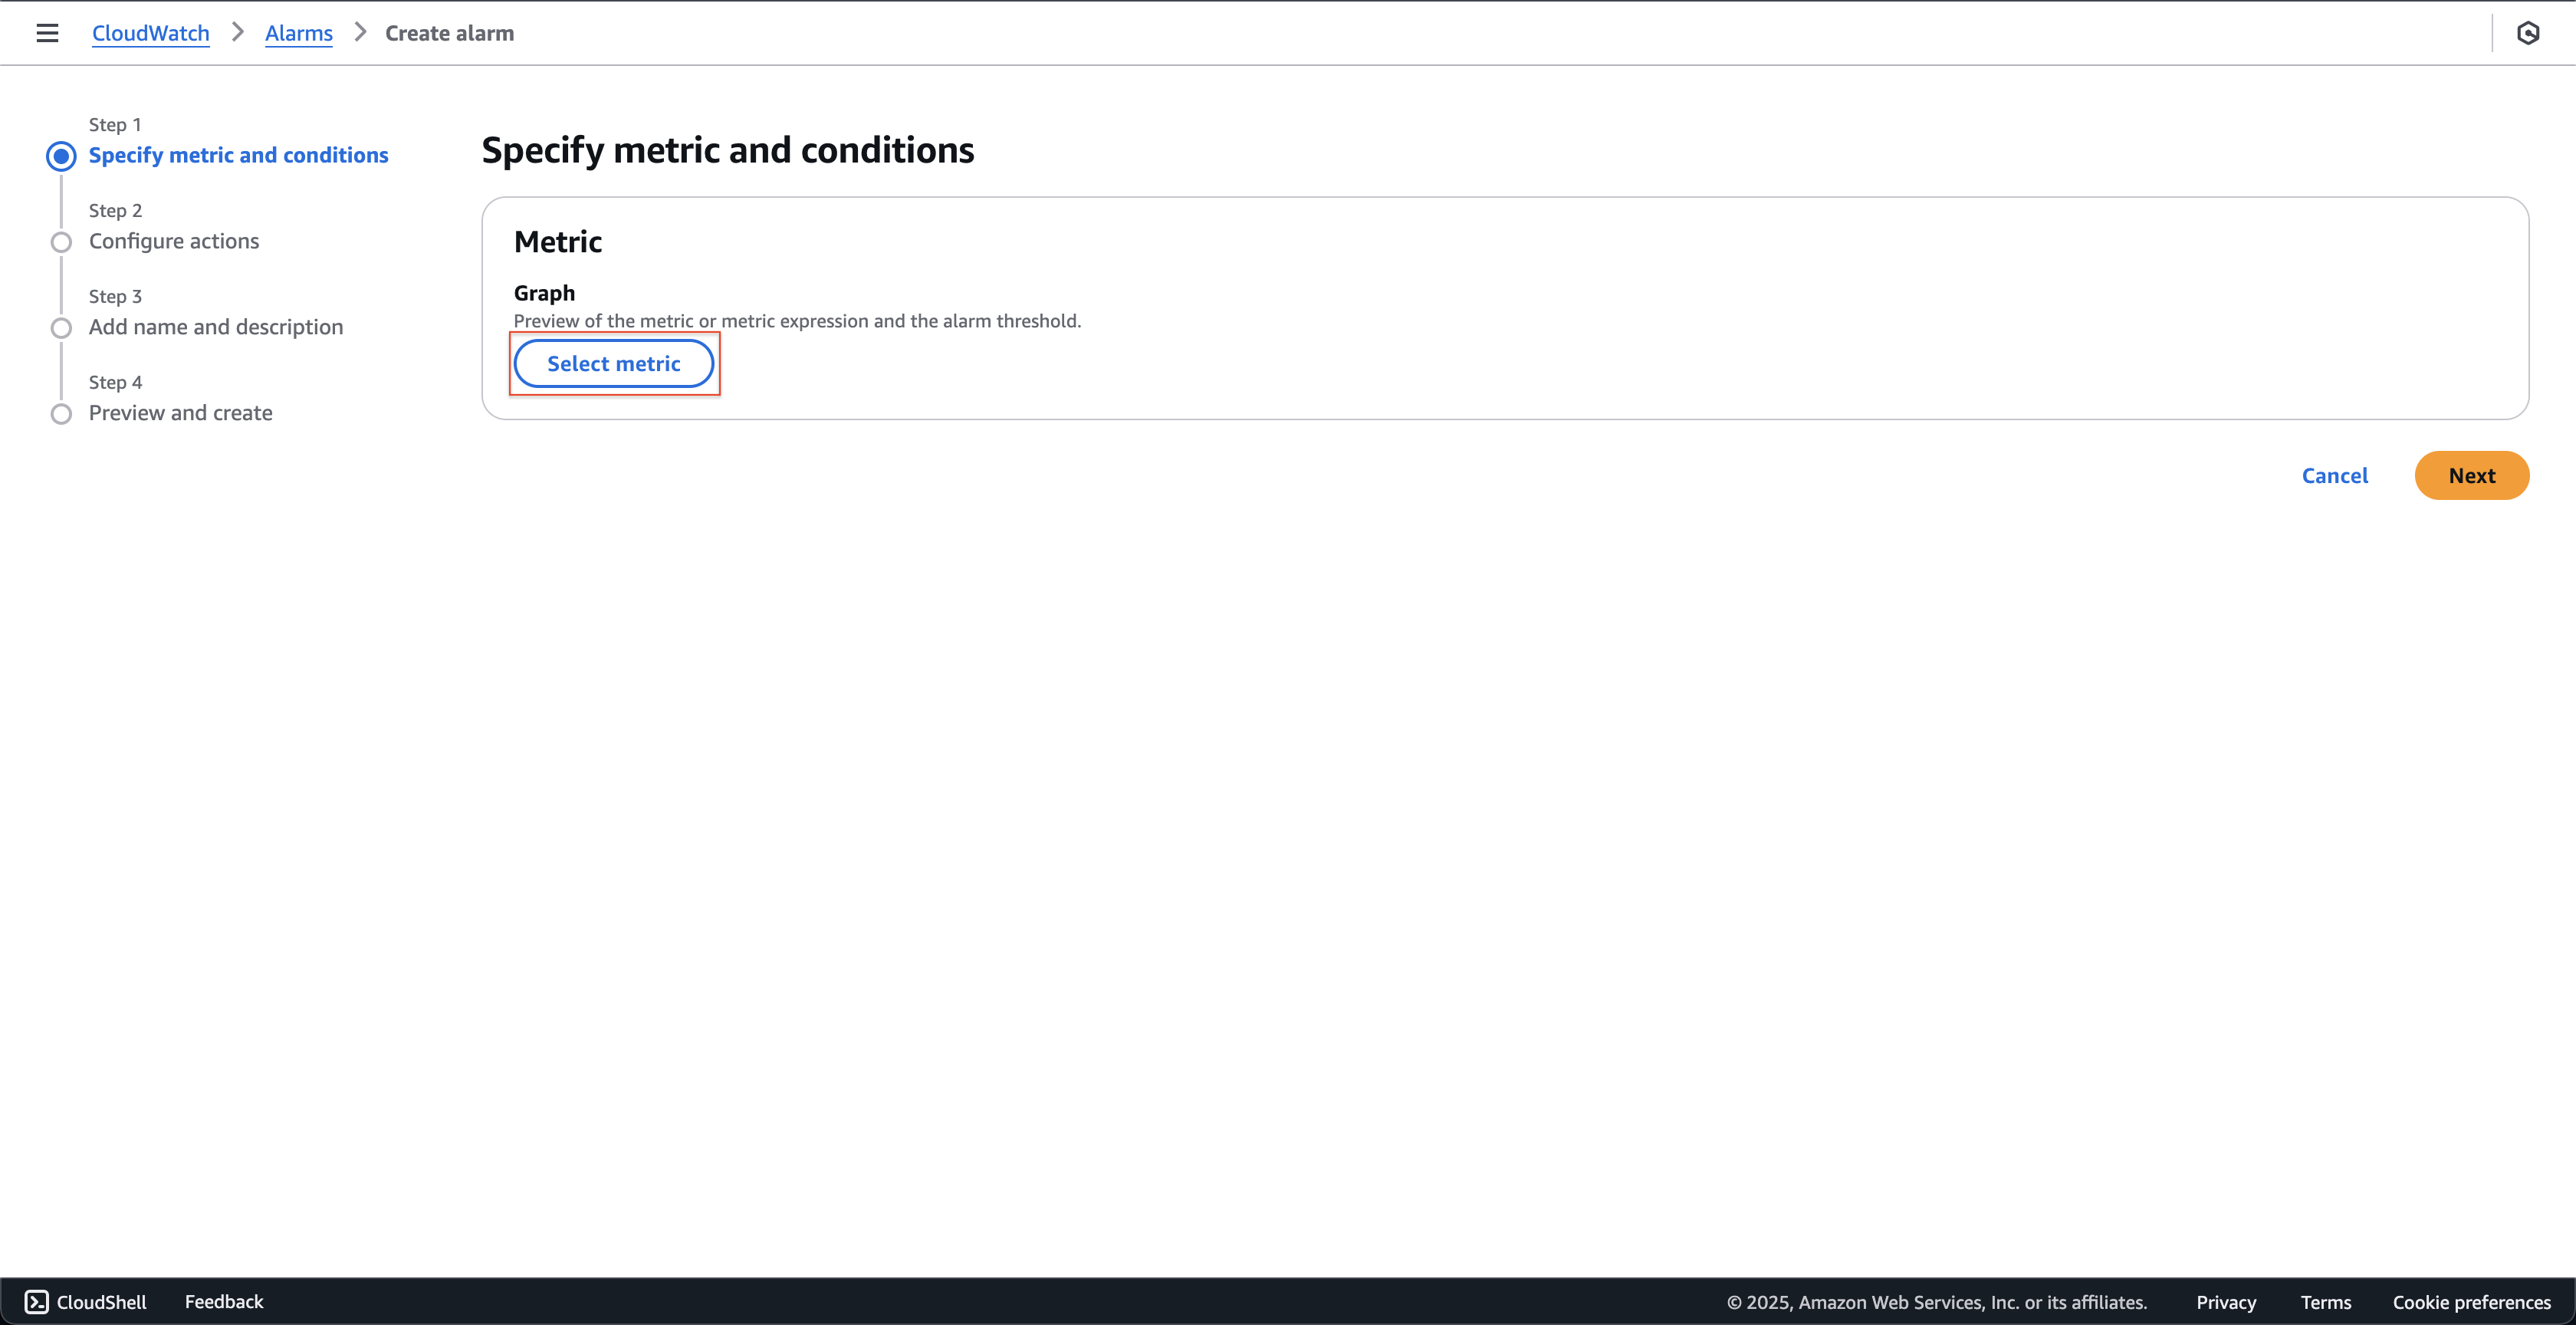
At Step 1: Specify metric and conditions page.
- Click the Select metric button.
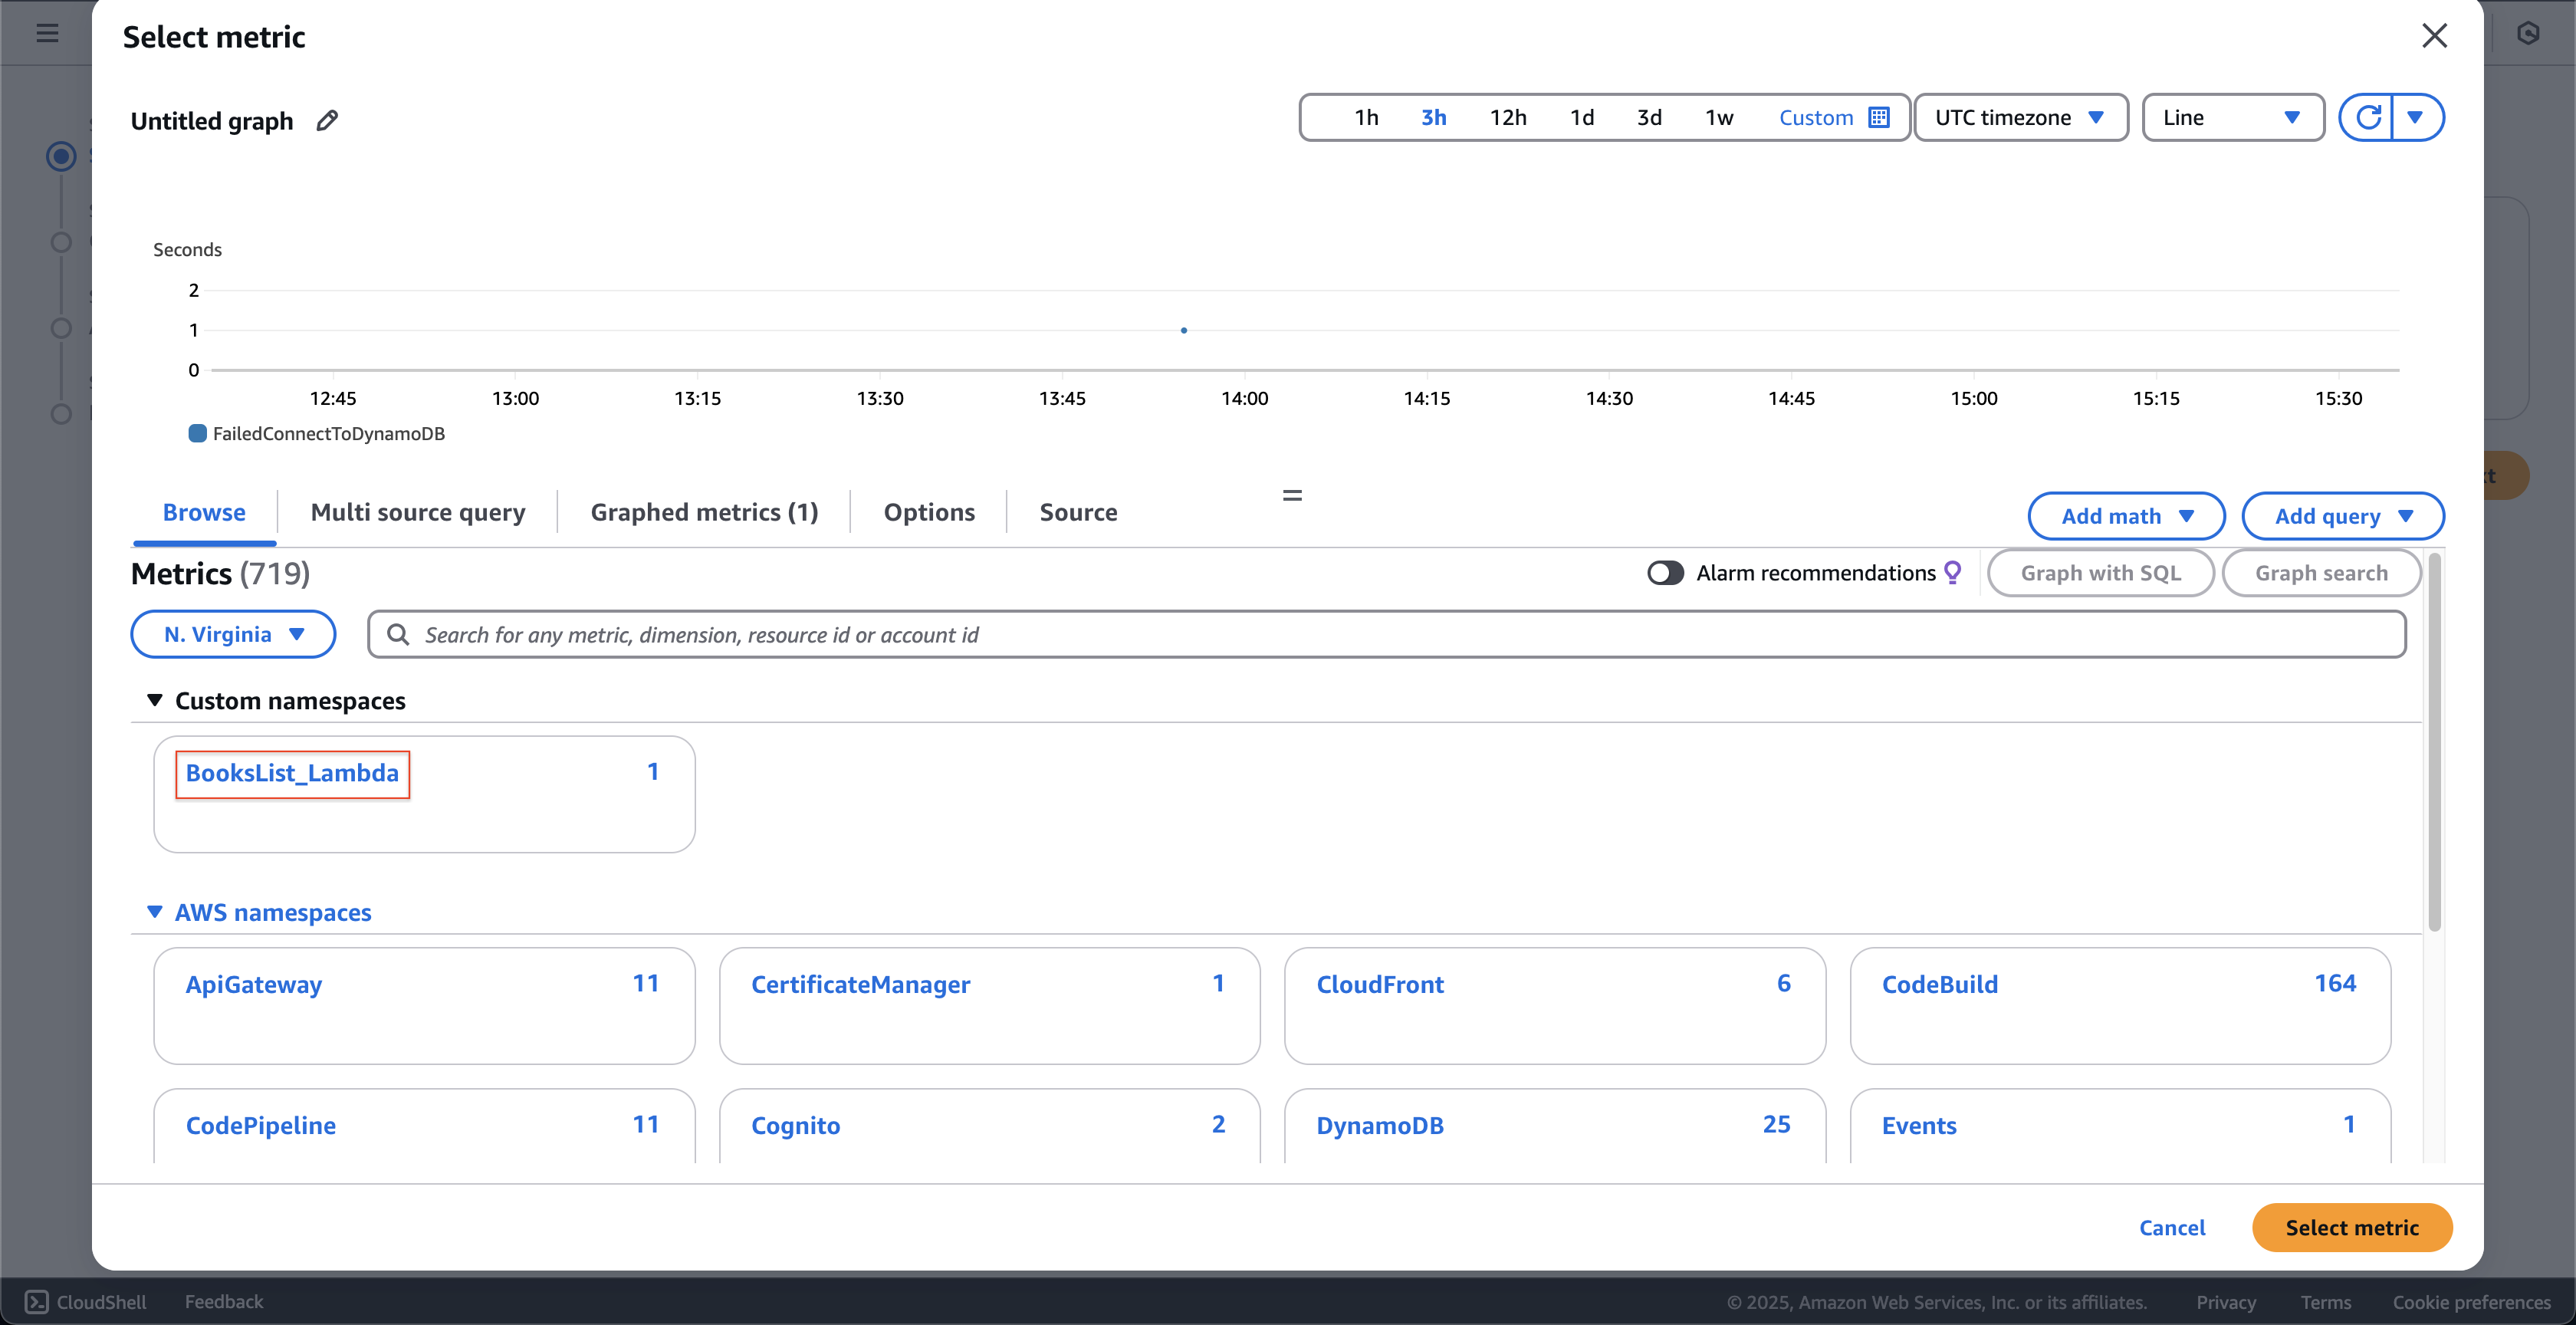
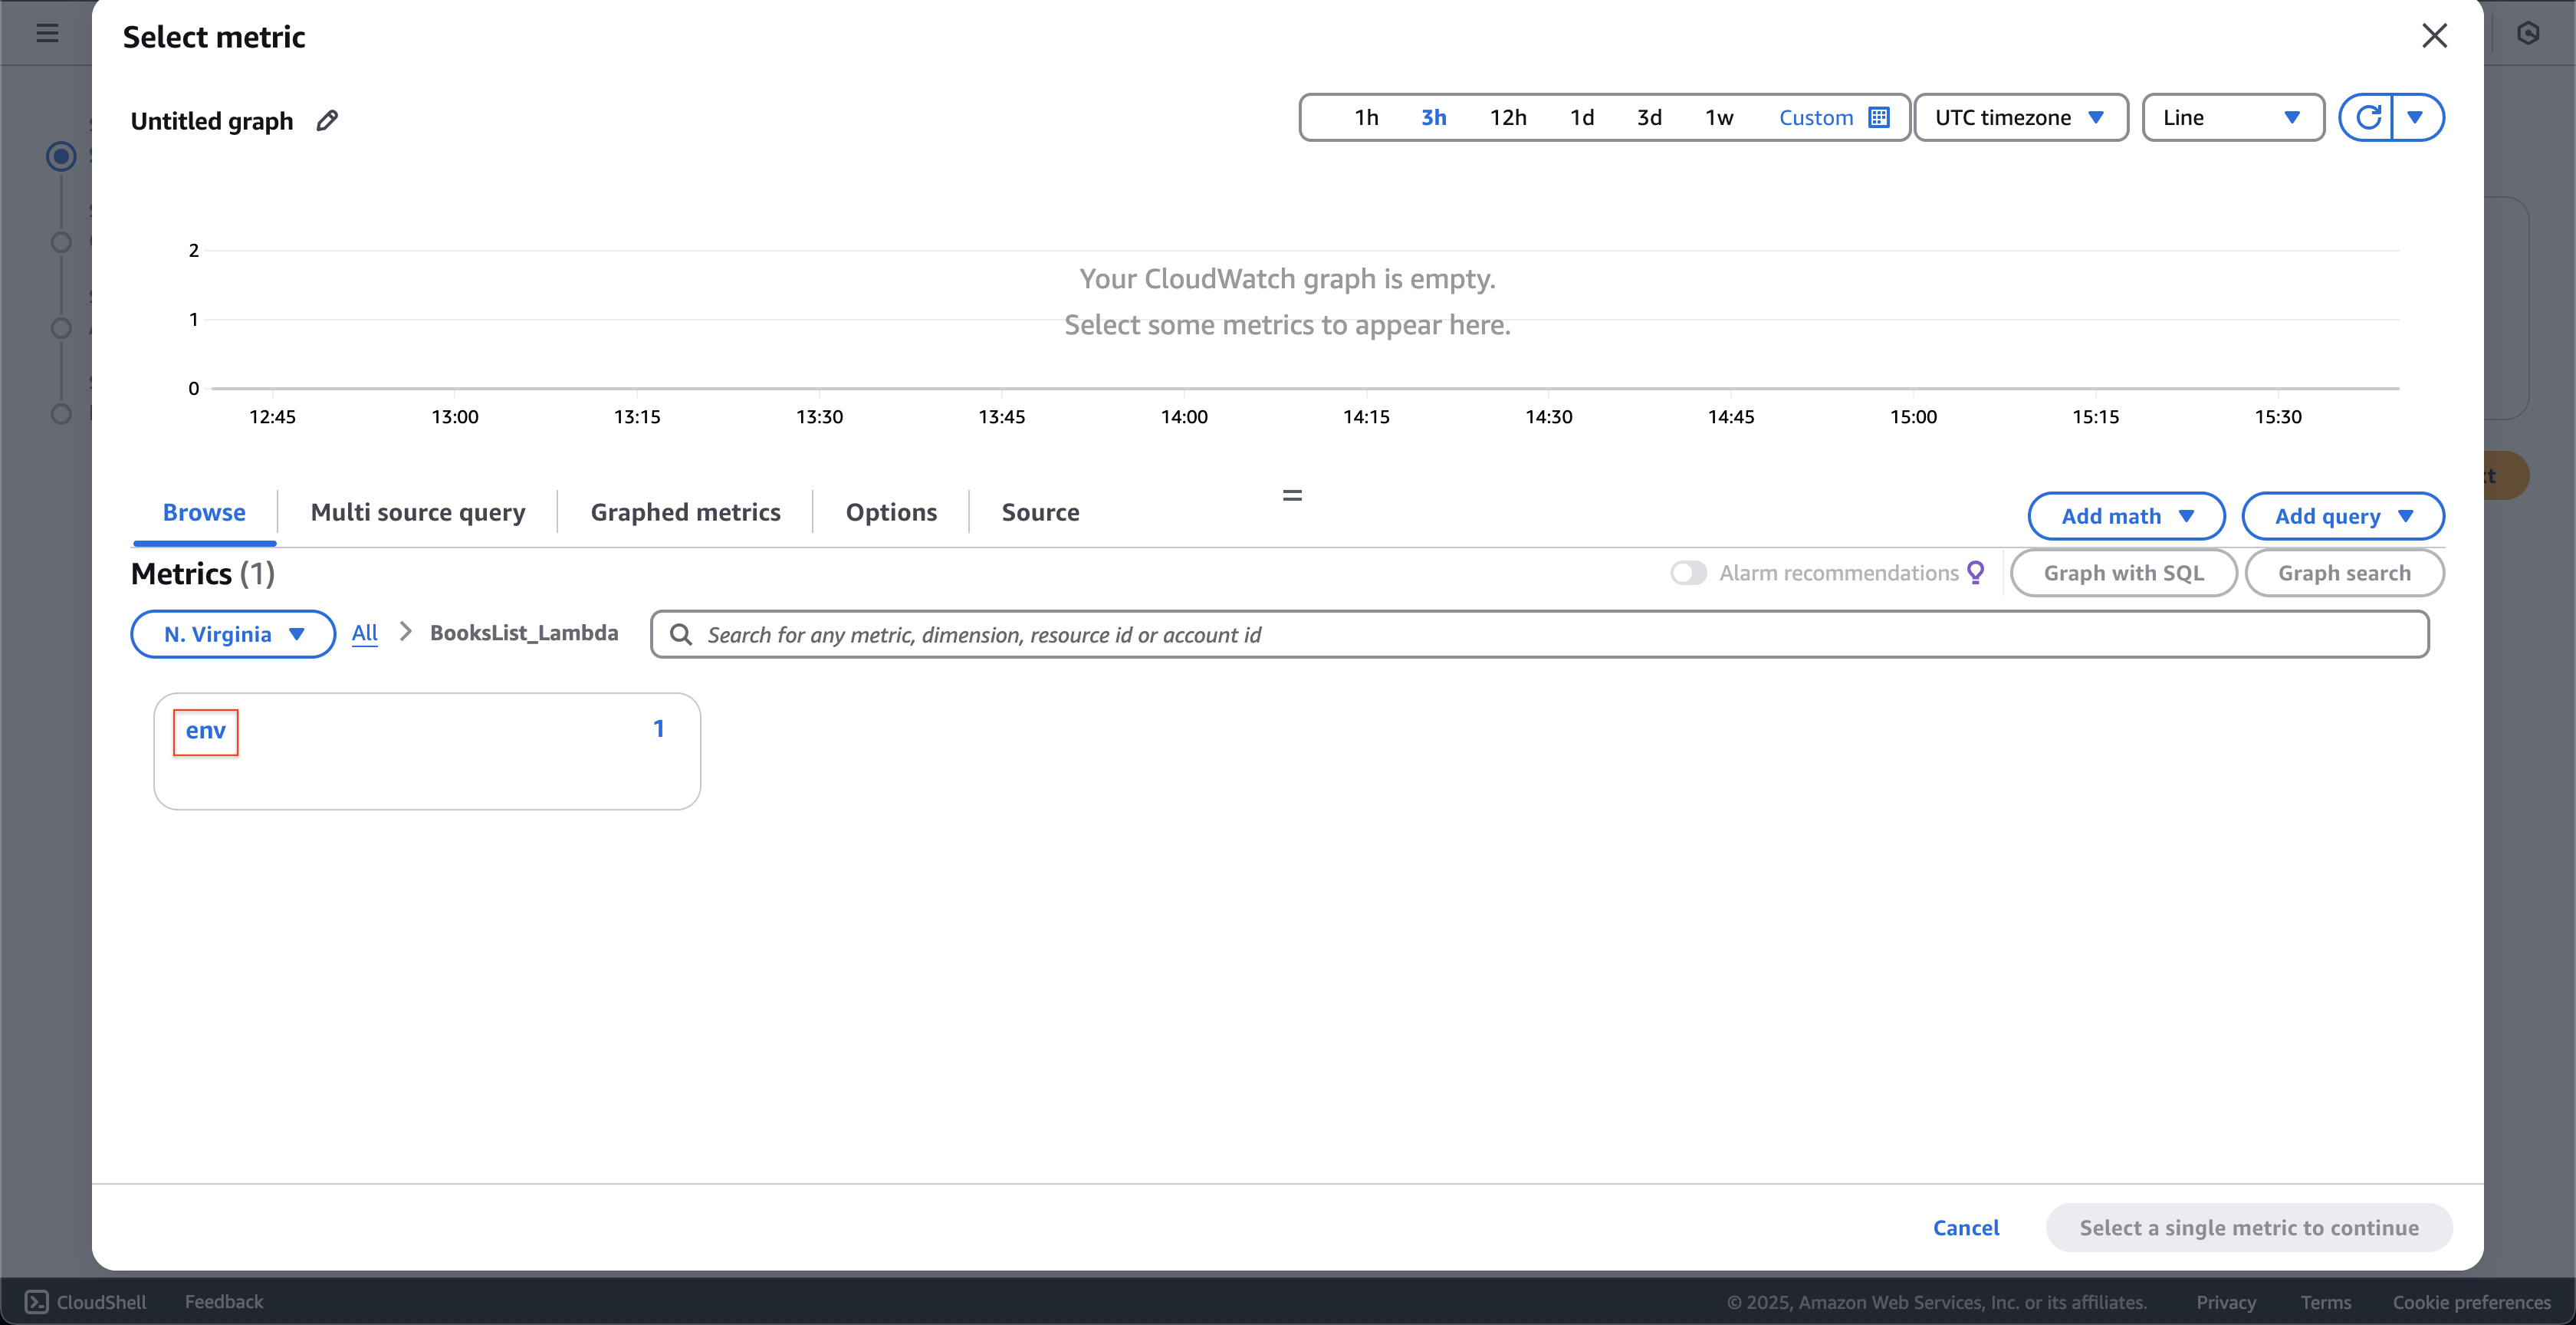
- At Select metric popup.
- Click the BooksList_Lambda at the Custom namespaces.
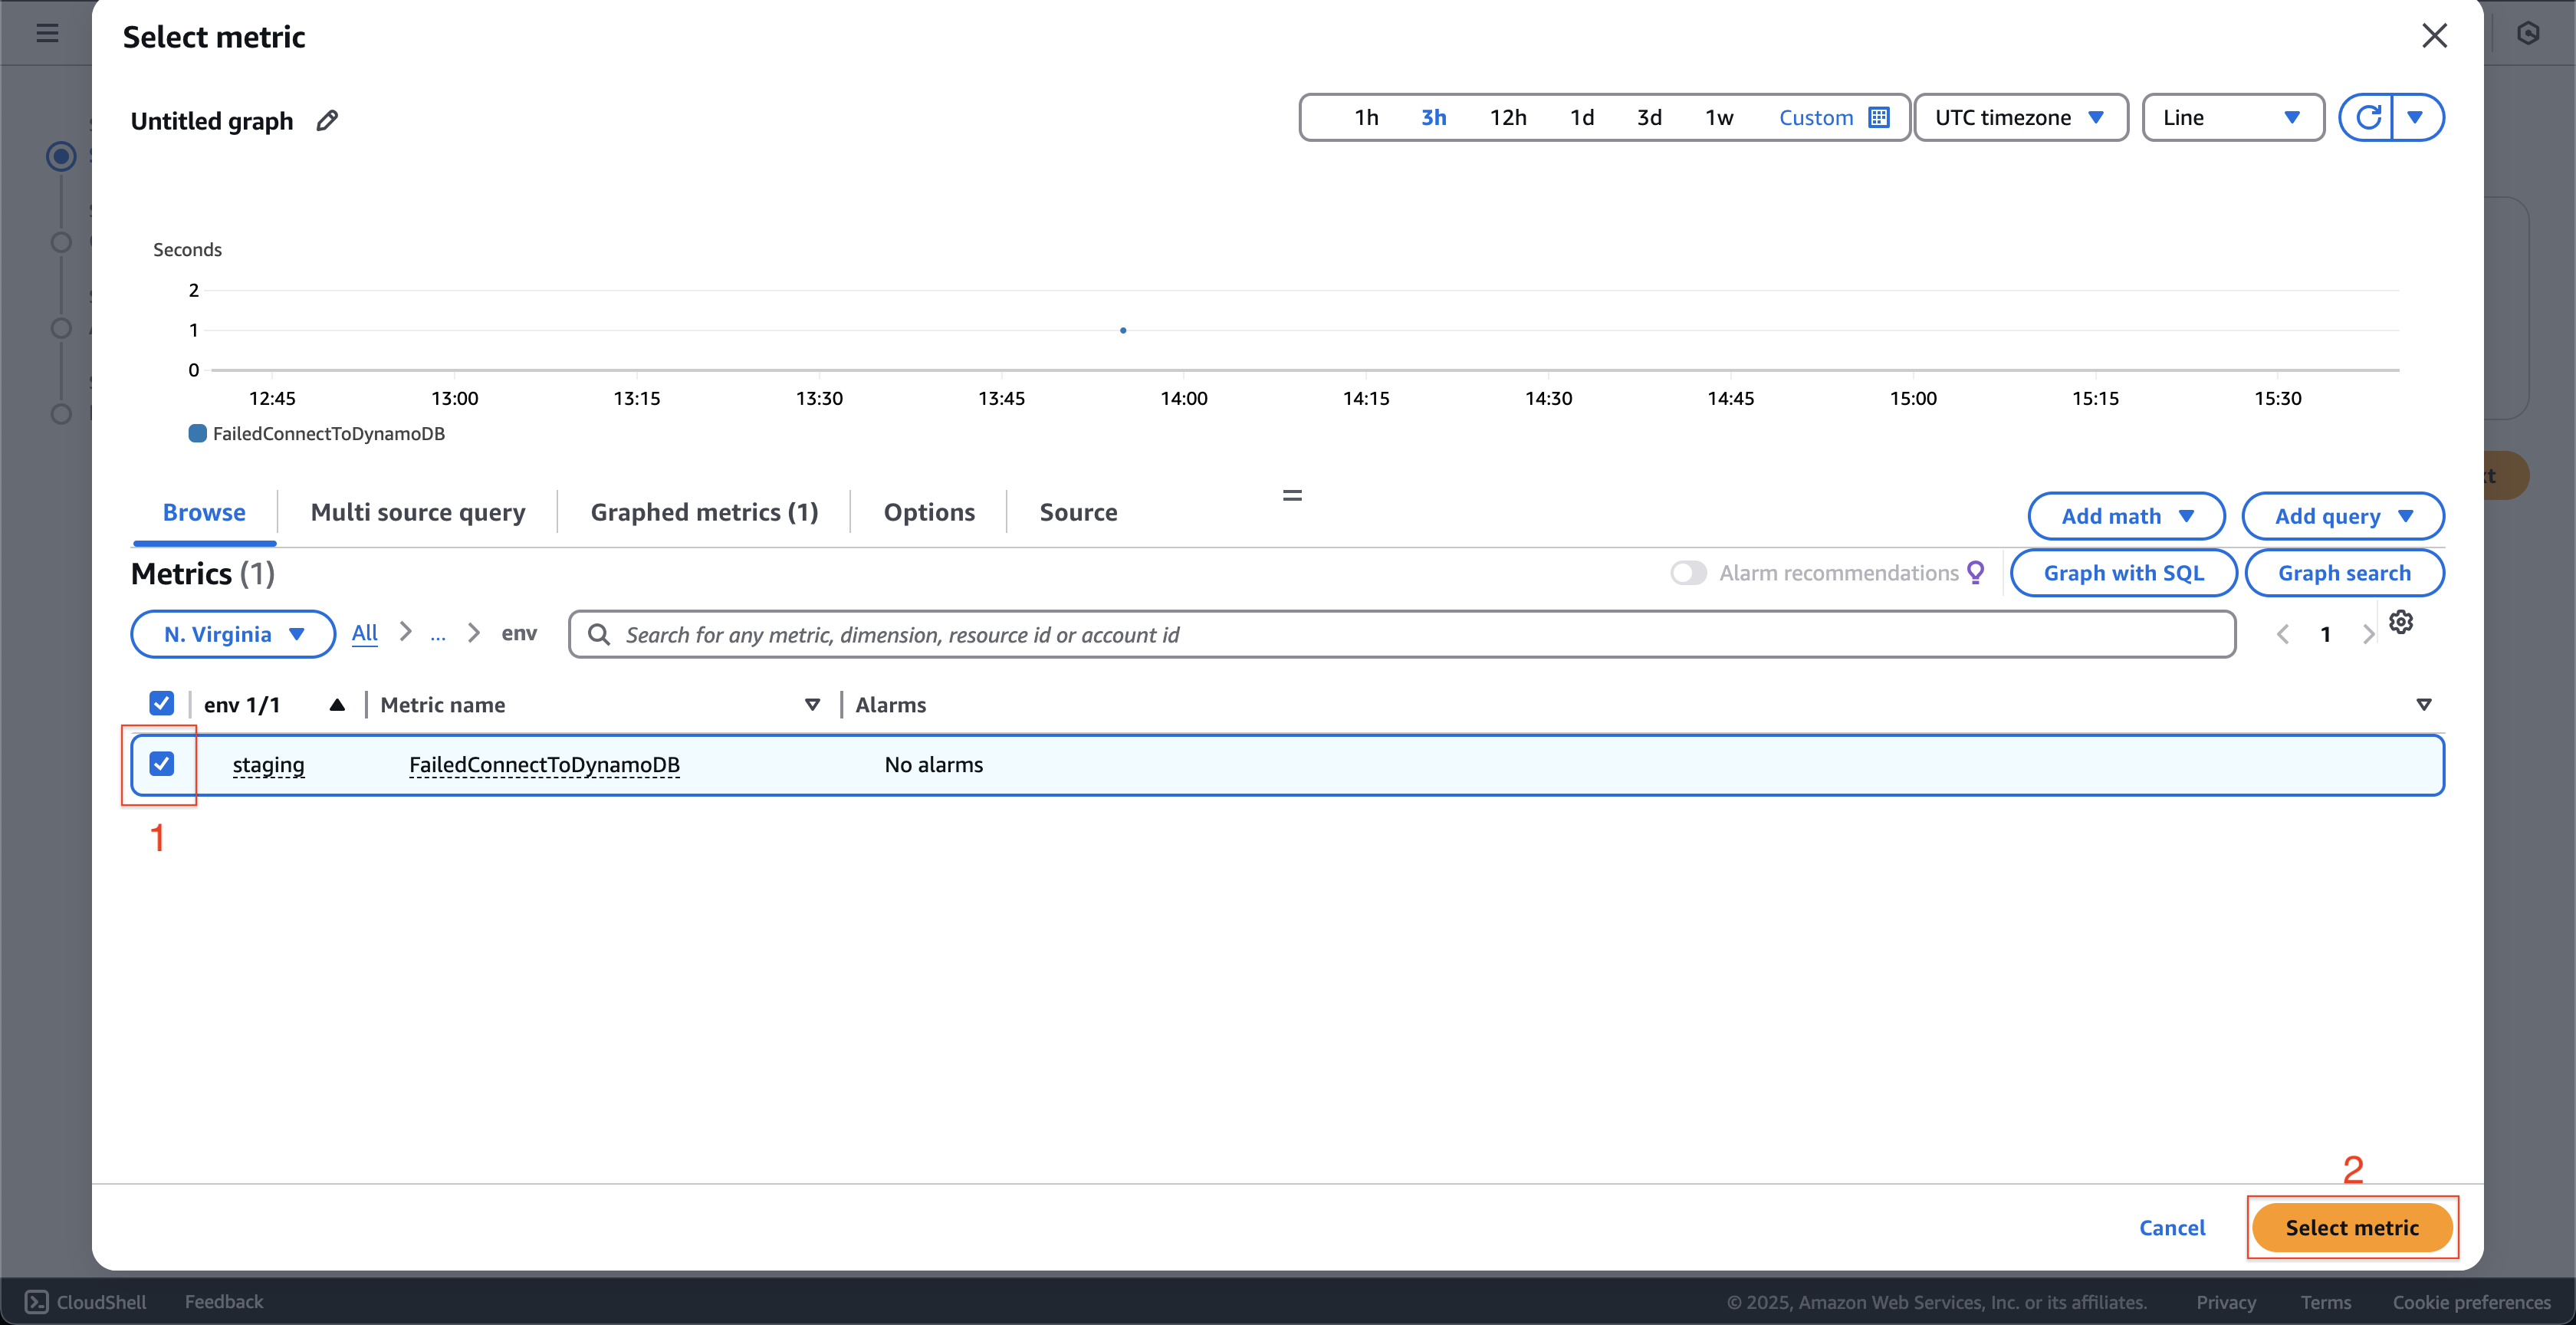
- Next, click the env.
- Check the staging.
- Click the Select metric button.
- Click the BooksList_Lambda at the Custom namespaces.
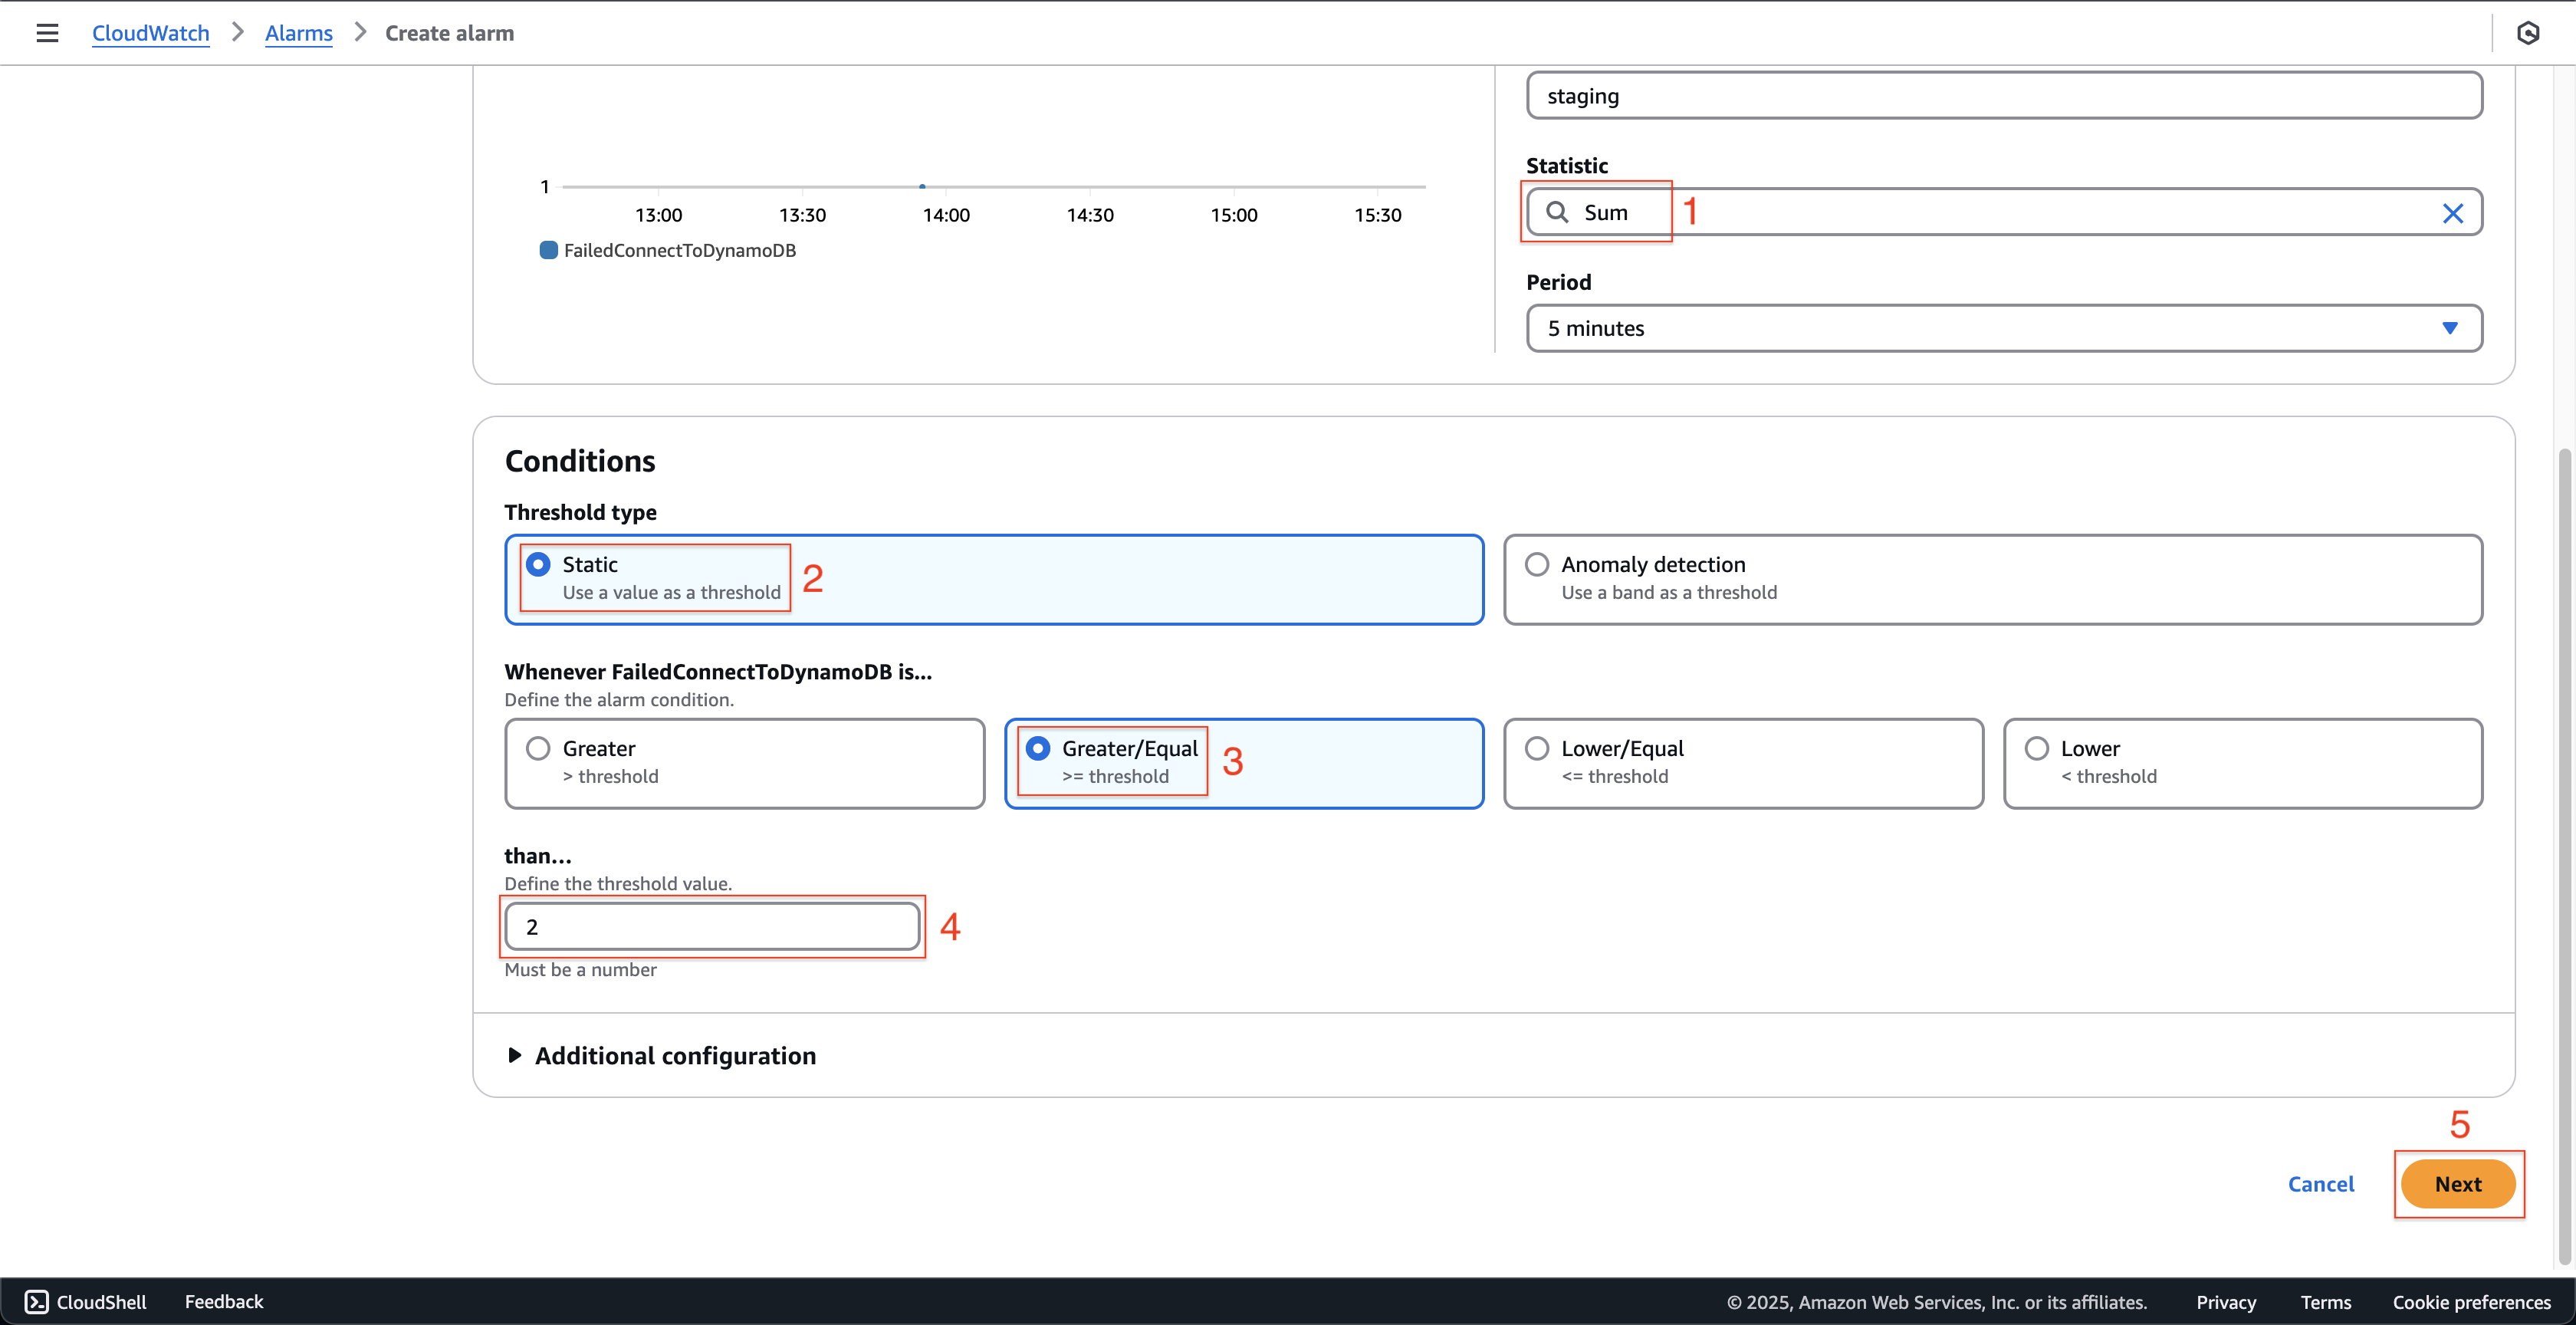
- Choose the Sum at Statistic.
- Choose the Static at Threshold type.
- Choose the Greater/Equal at Whenever FailedConnectToDynamoDB is….
- Enter
2at than…. - Click the Next button.
- Click the Select metric button.
-
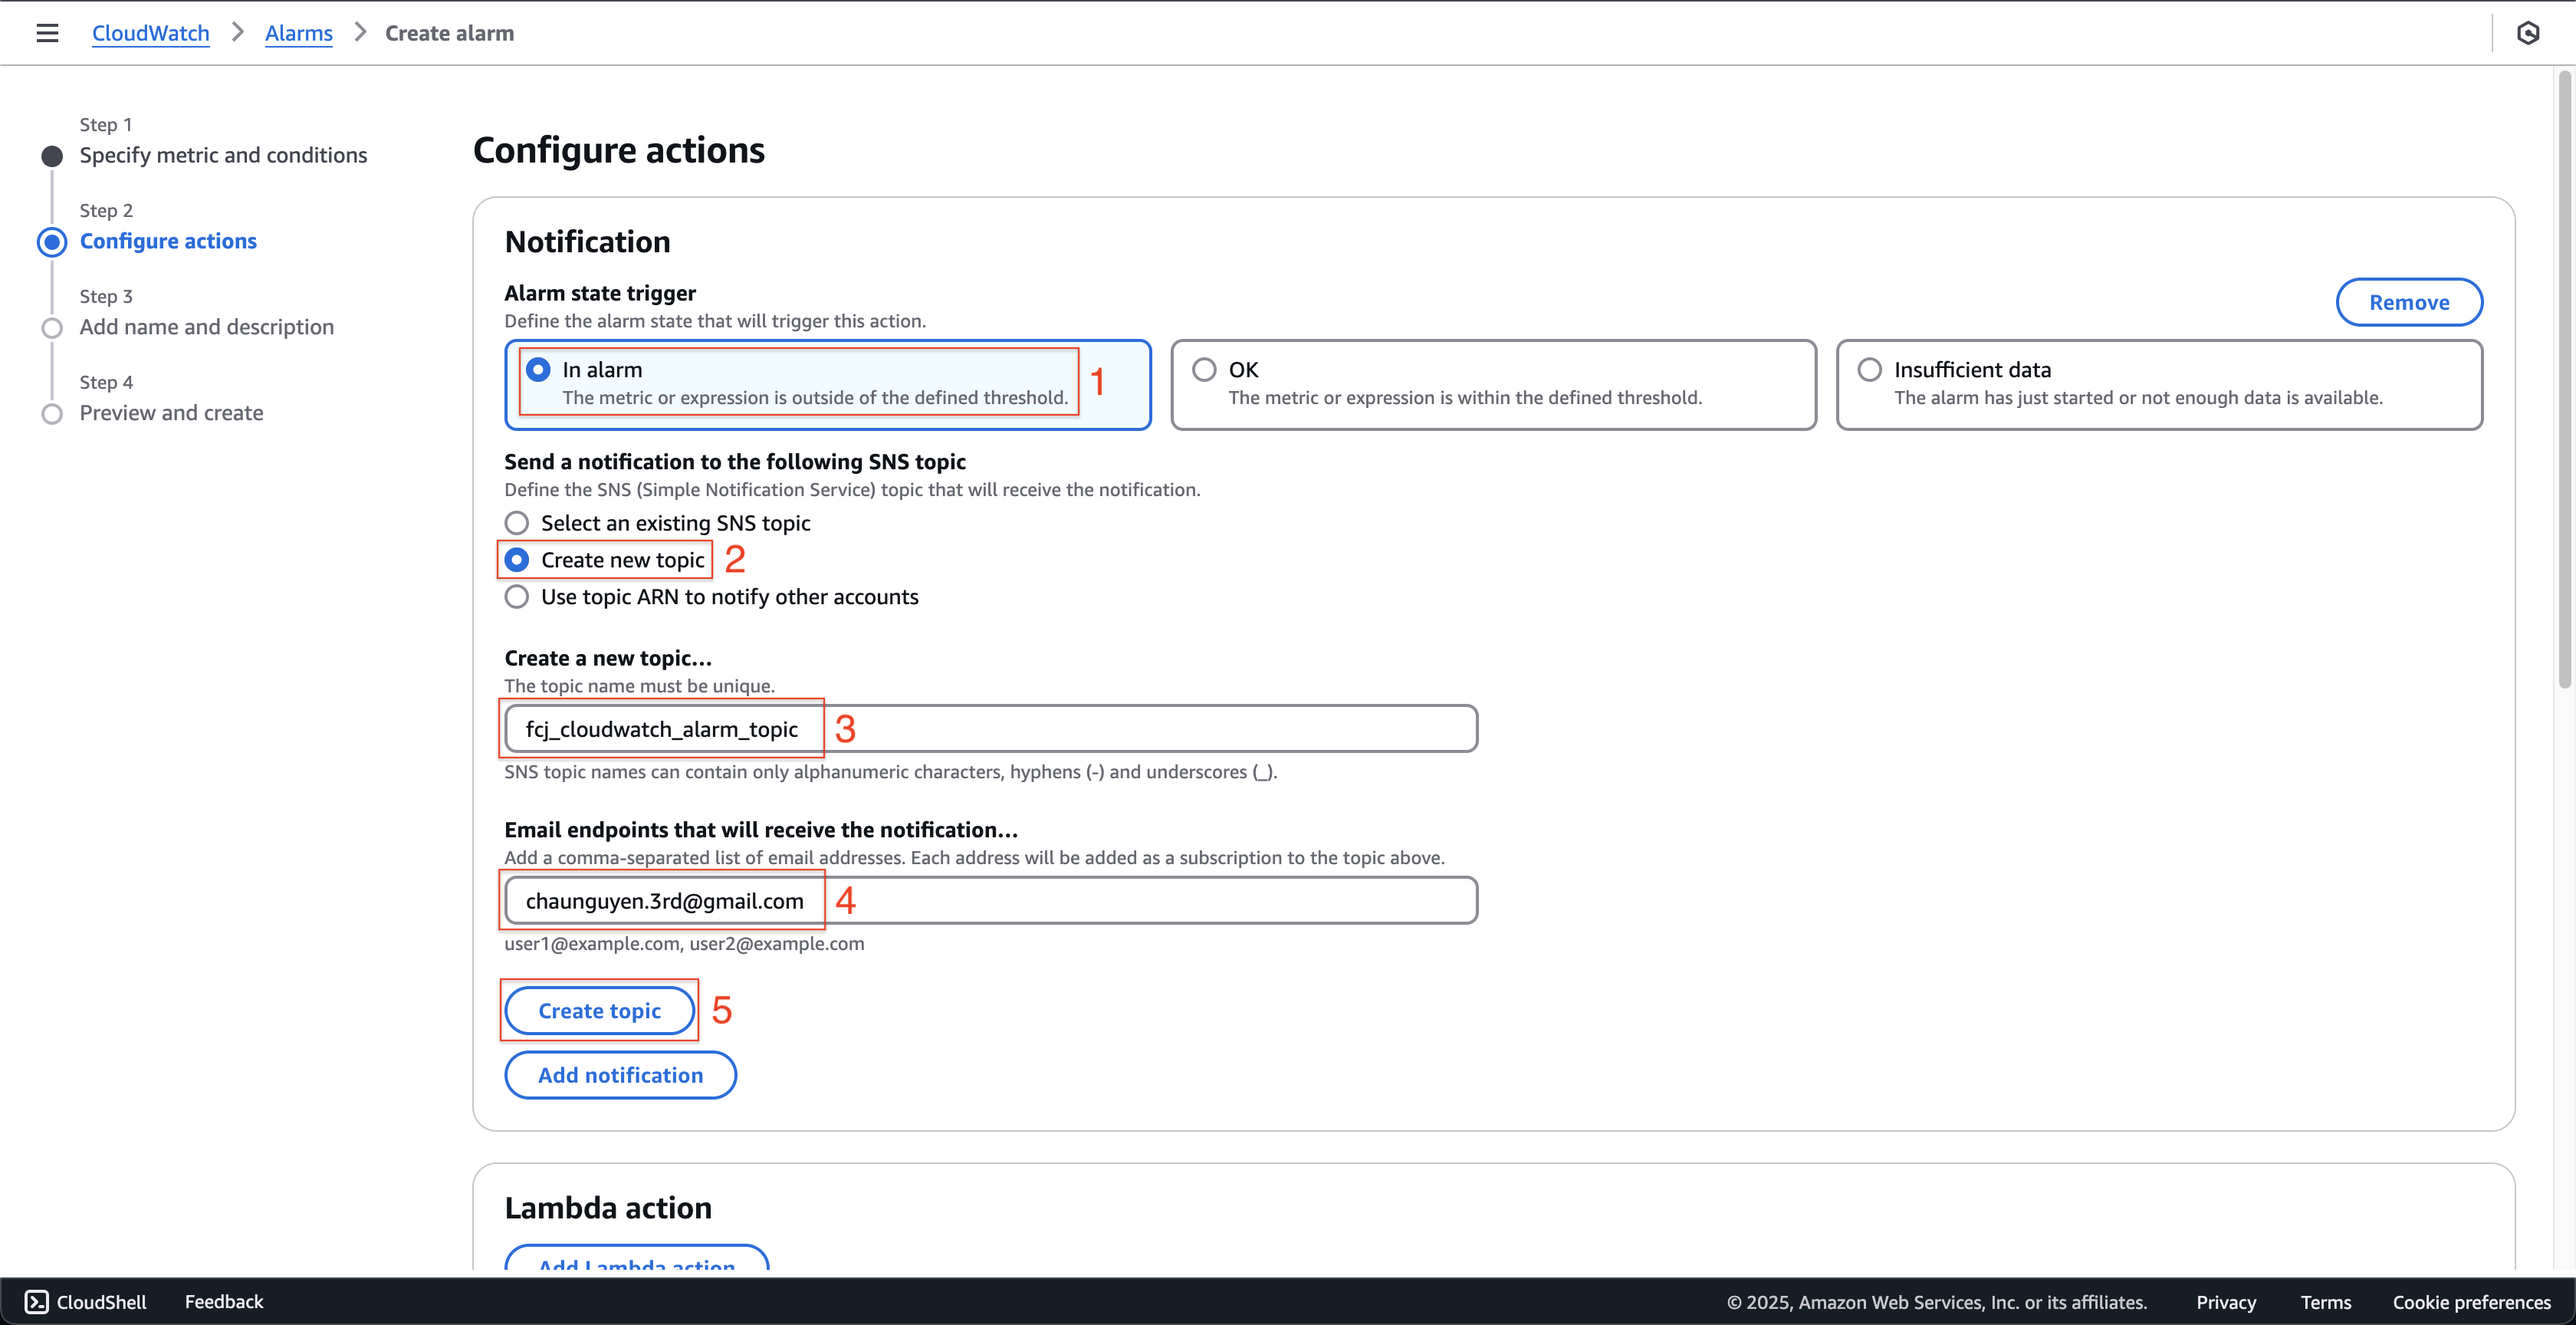
At Step 2: Configure actions page.
- Choose the In alarm at Alarm state trigger.
- Choose the Create new topic at Send a notification to the following SNS topic.
- Enter
fcj_cloudwatch_alarm_topicat Create a new topic…. - Enter the email that you want to receive the notification.
- Click the Create topic button.
-
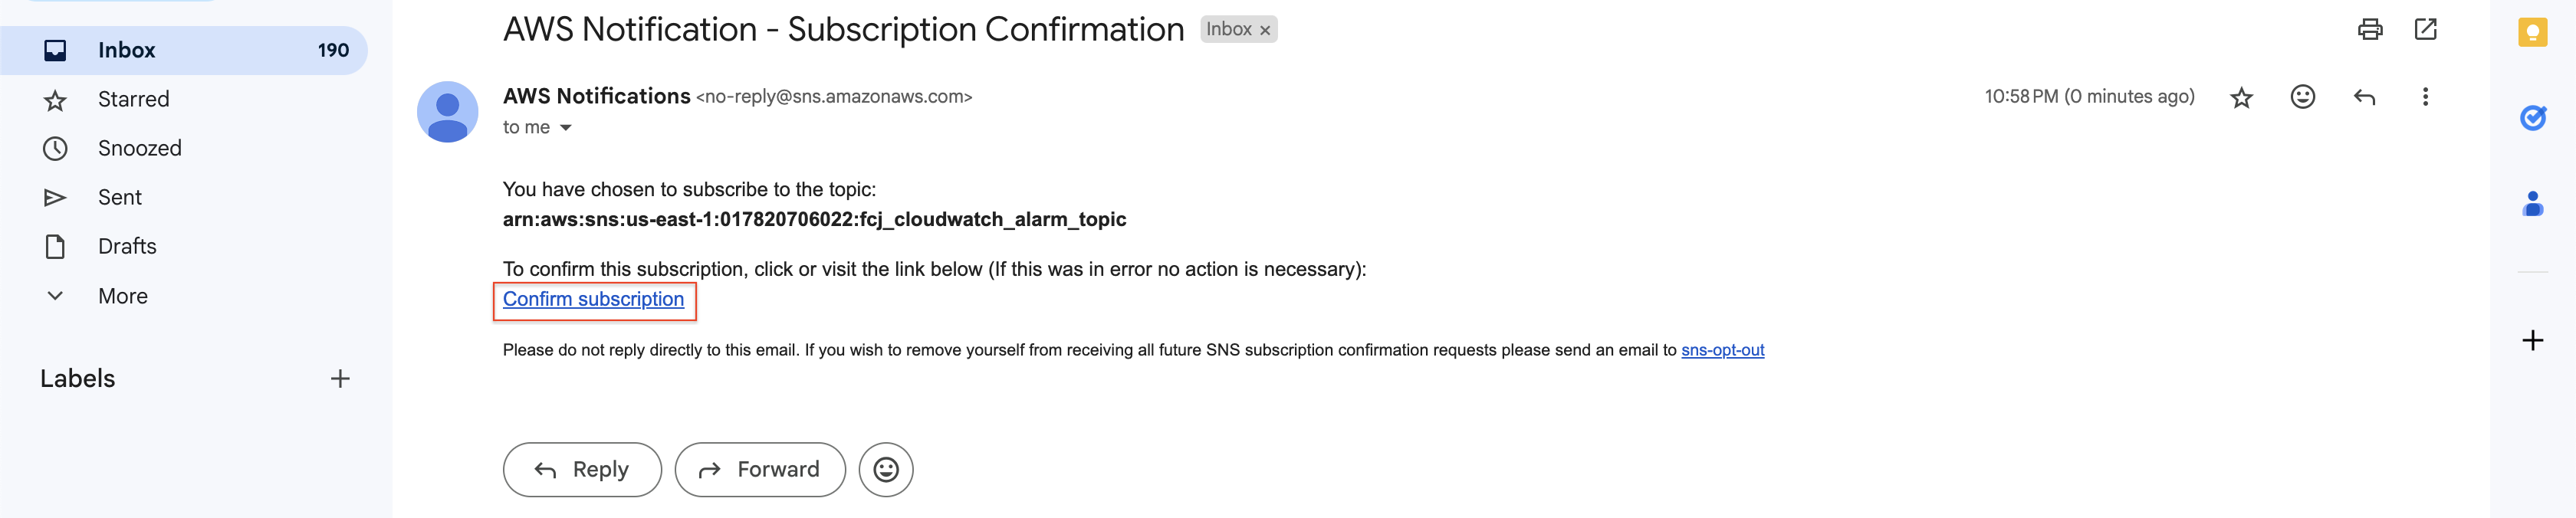
Open the email that you chose to receive the notification before.
- Click the Confirm subscription.
- Then you will receive the Subscription confirmed notification.
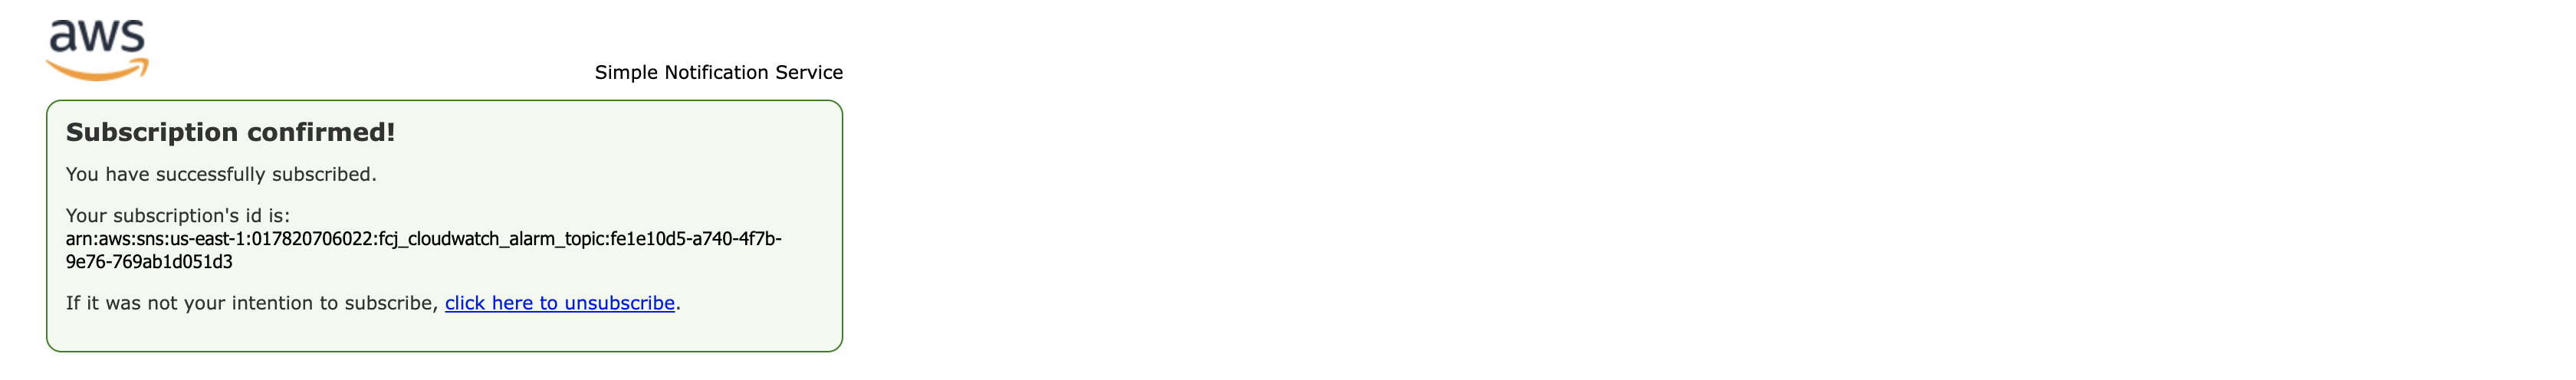
- Click the Confirm subscription.
-
Back to Step 2: Configure actions page.
- Scroll down to the bottom and click the Next button.
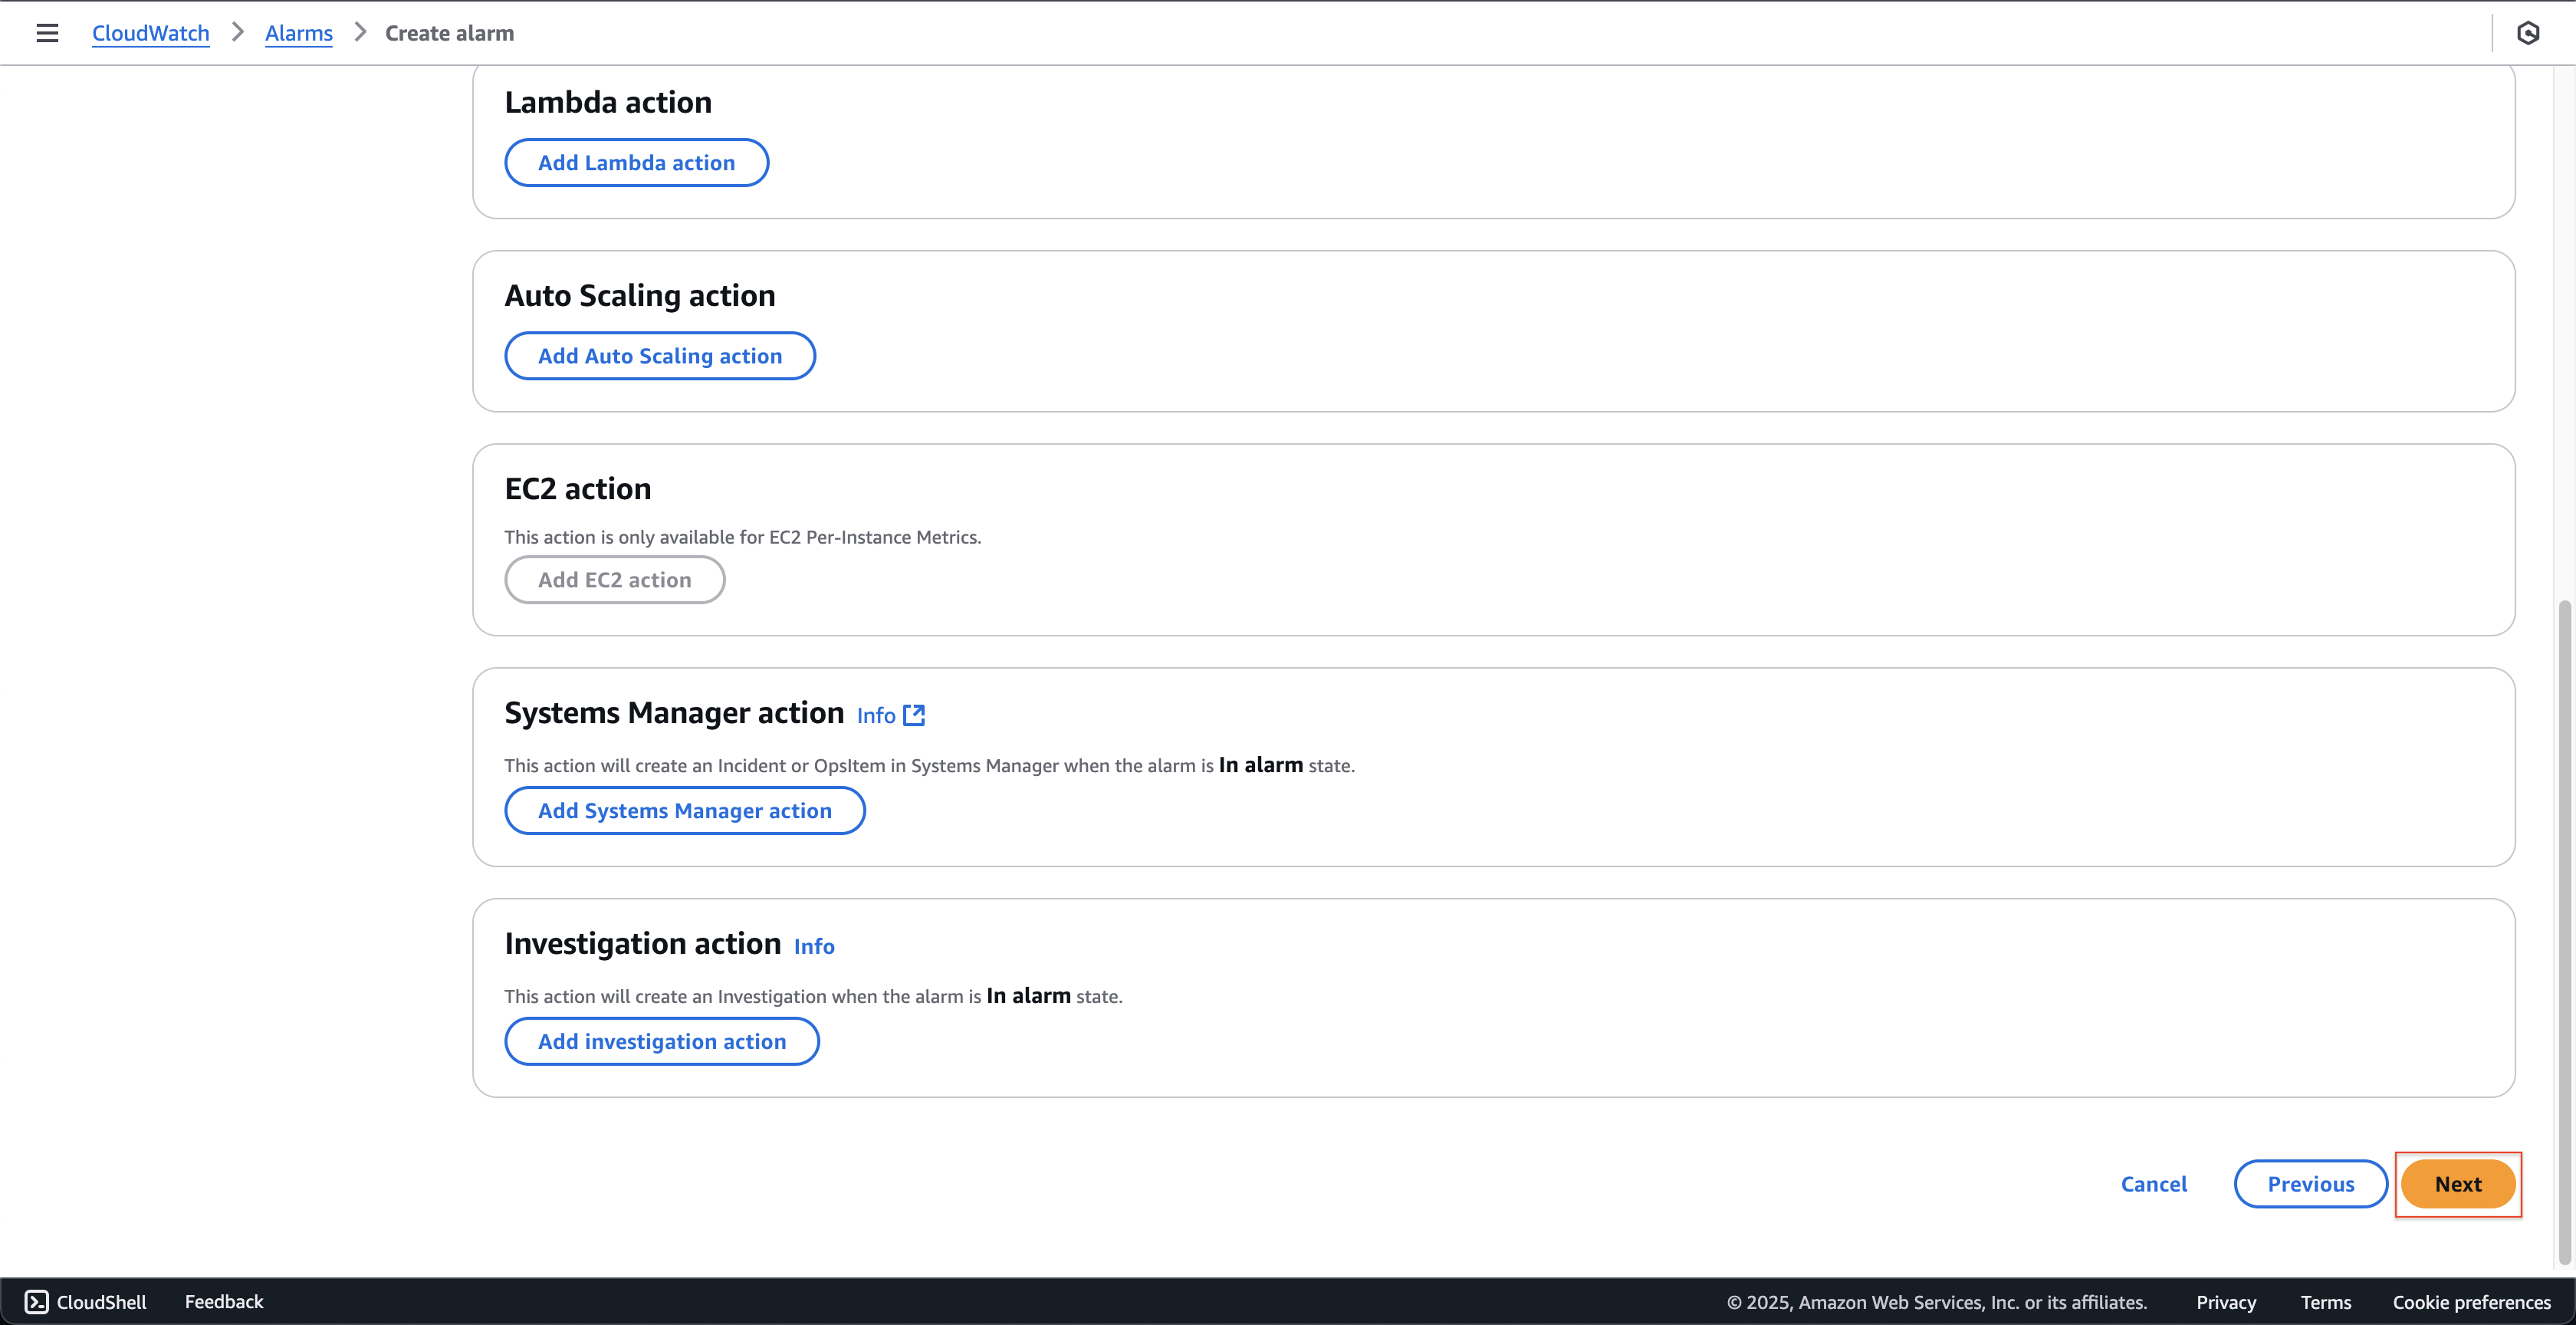
- Scroll down to the bottom and click the Next button.
-
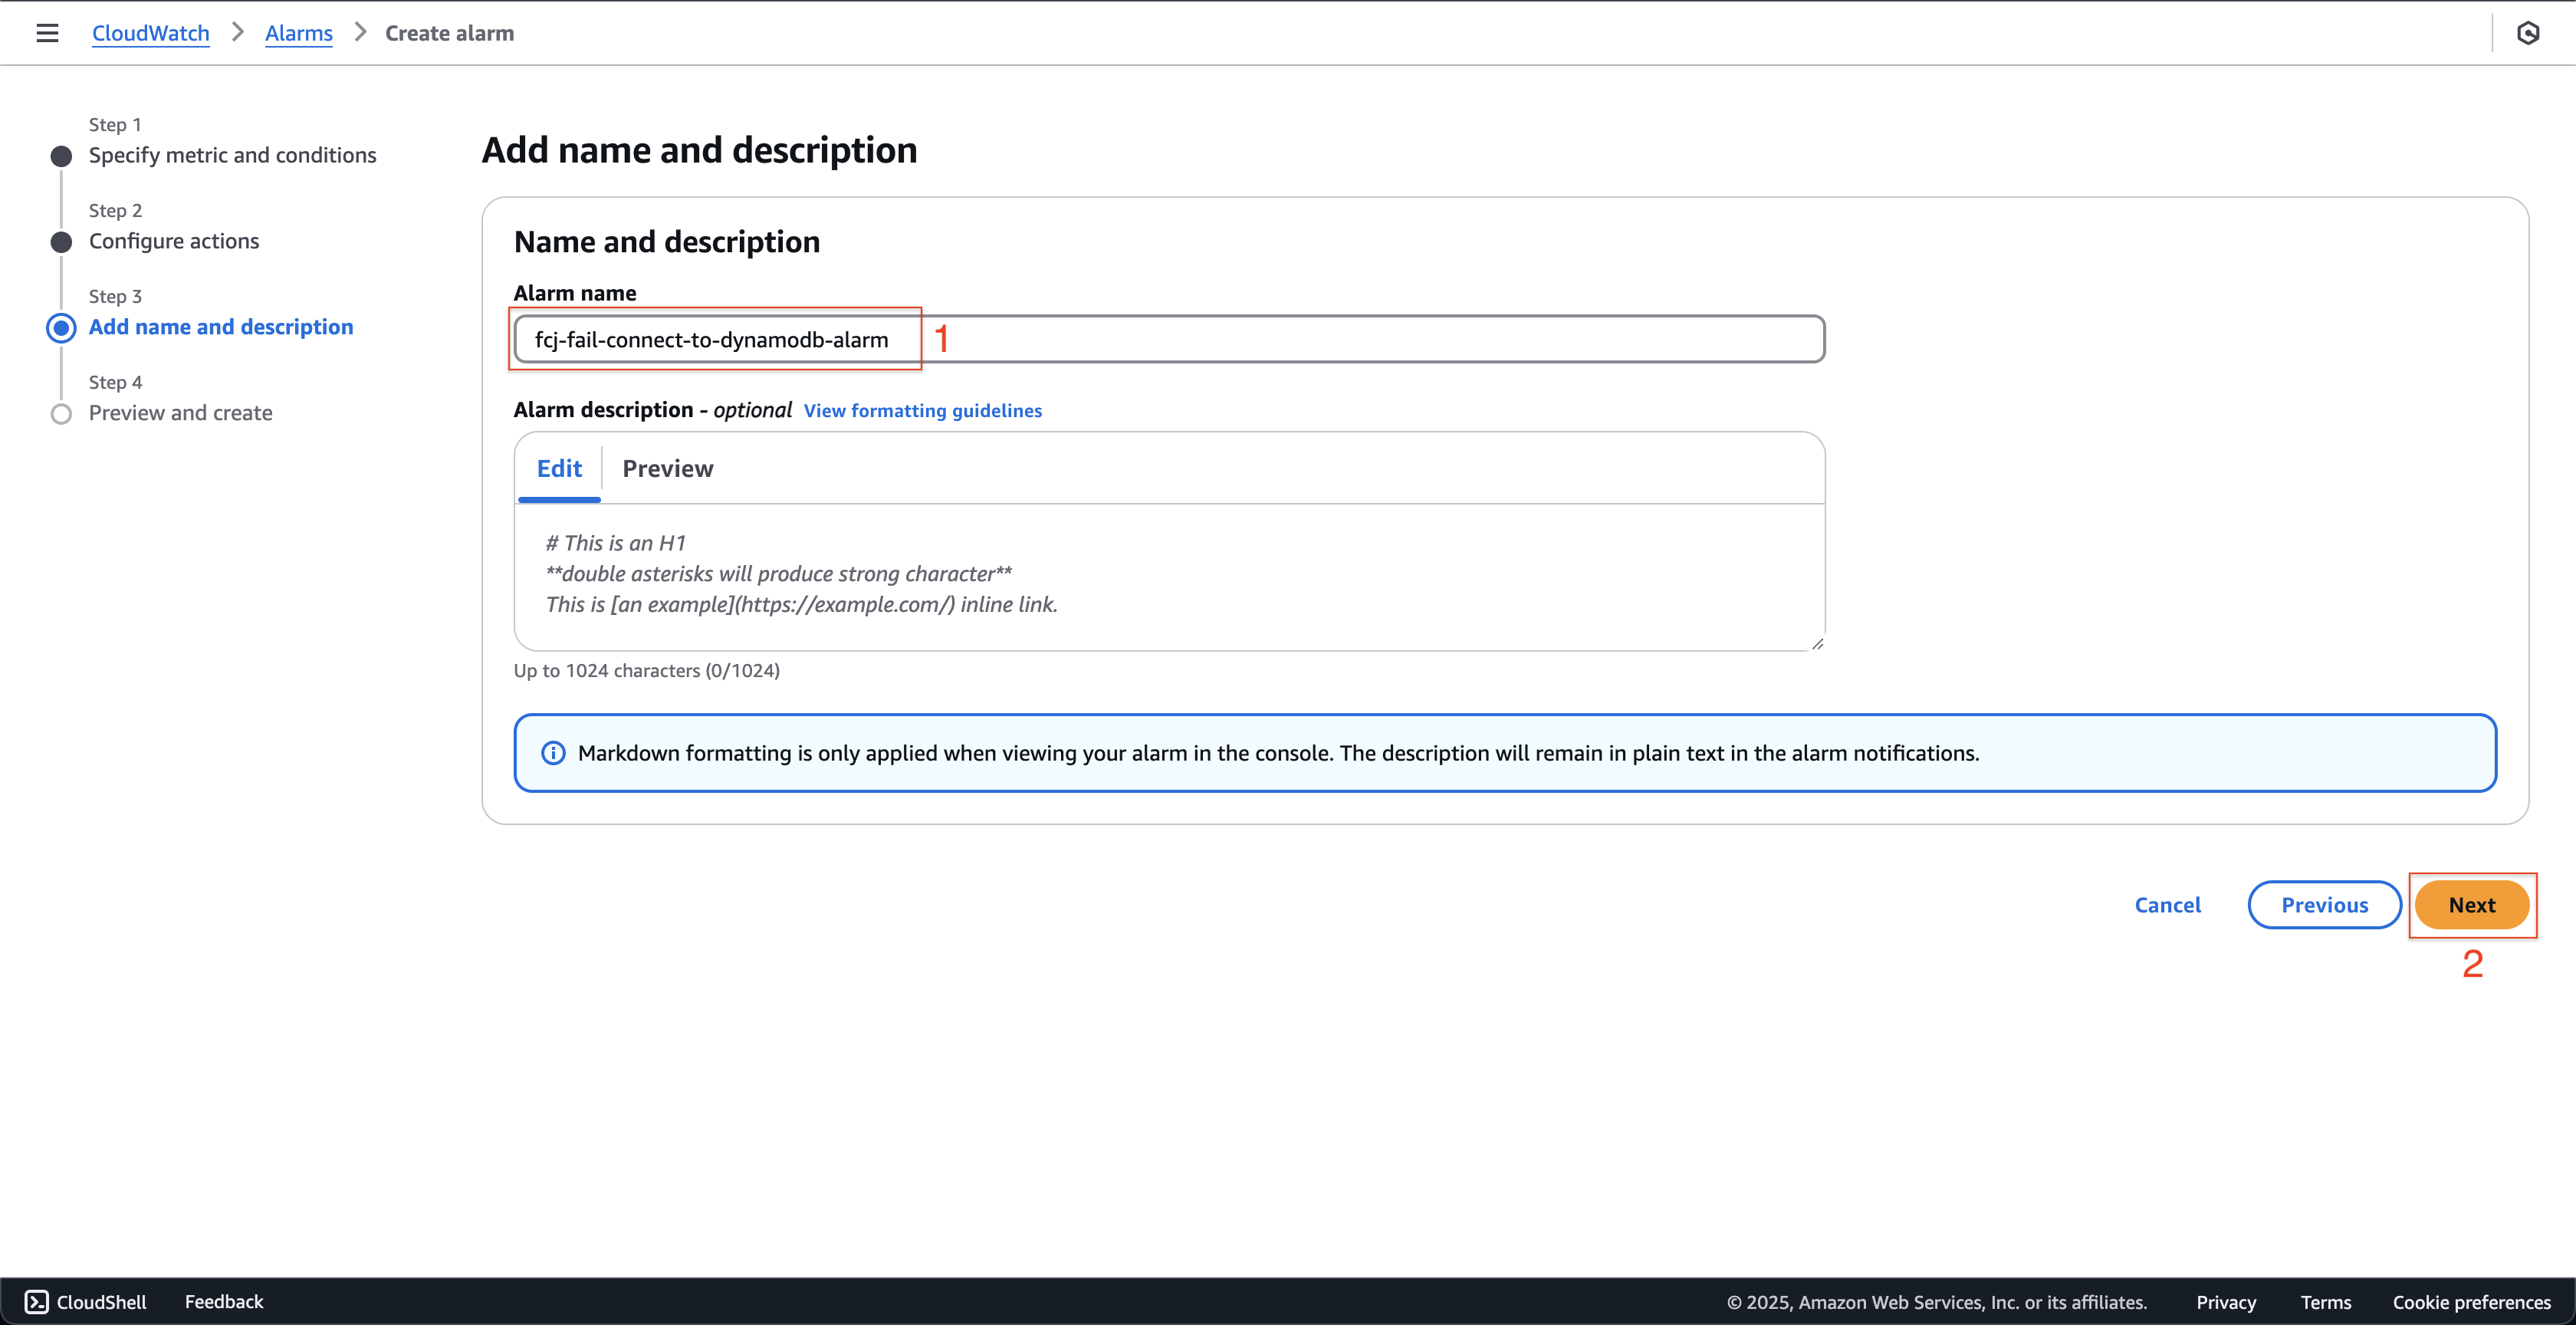
At Step 3: Add name and description page.
- Enter
fcj-fail-connect-to-dynamodb-alarmat Alarm name. - Click the Next button.
- Enter
-
At Step 4: Preview and create page.
- Click the Create alarm button.
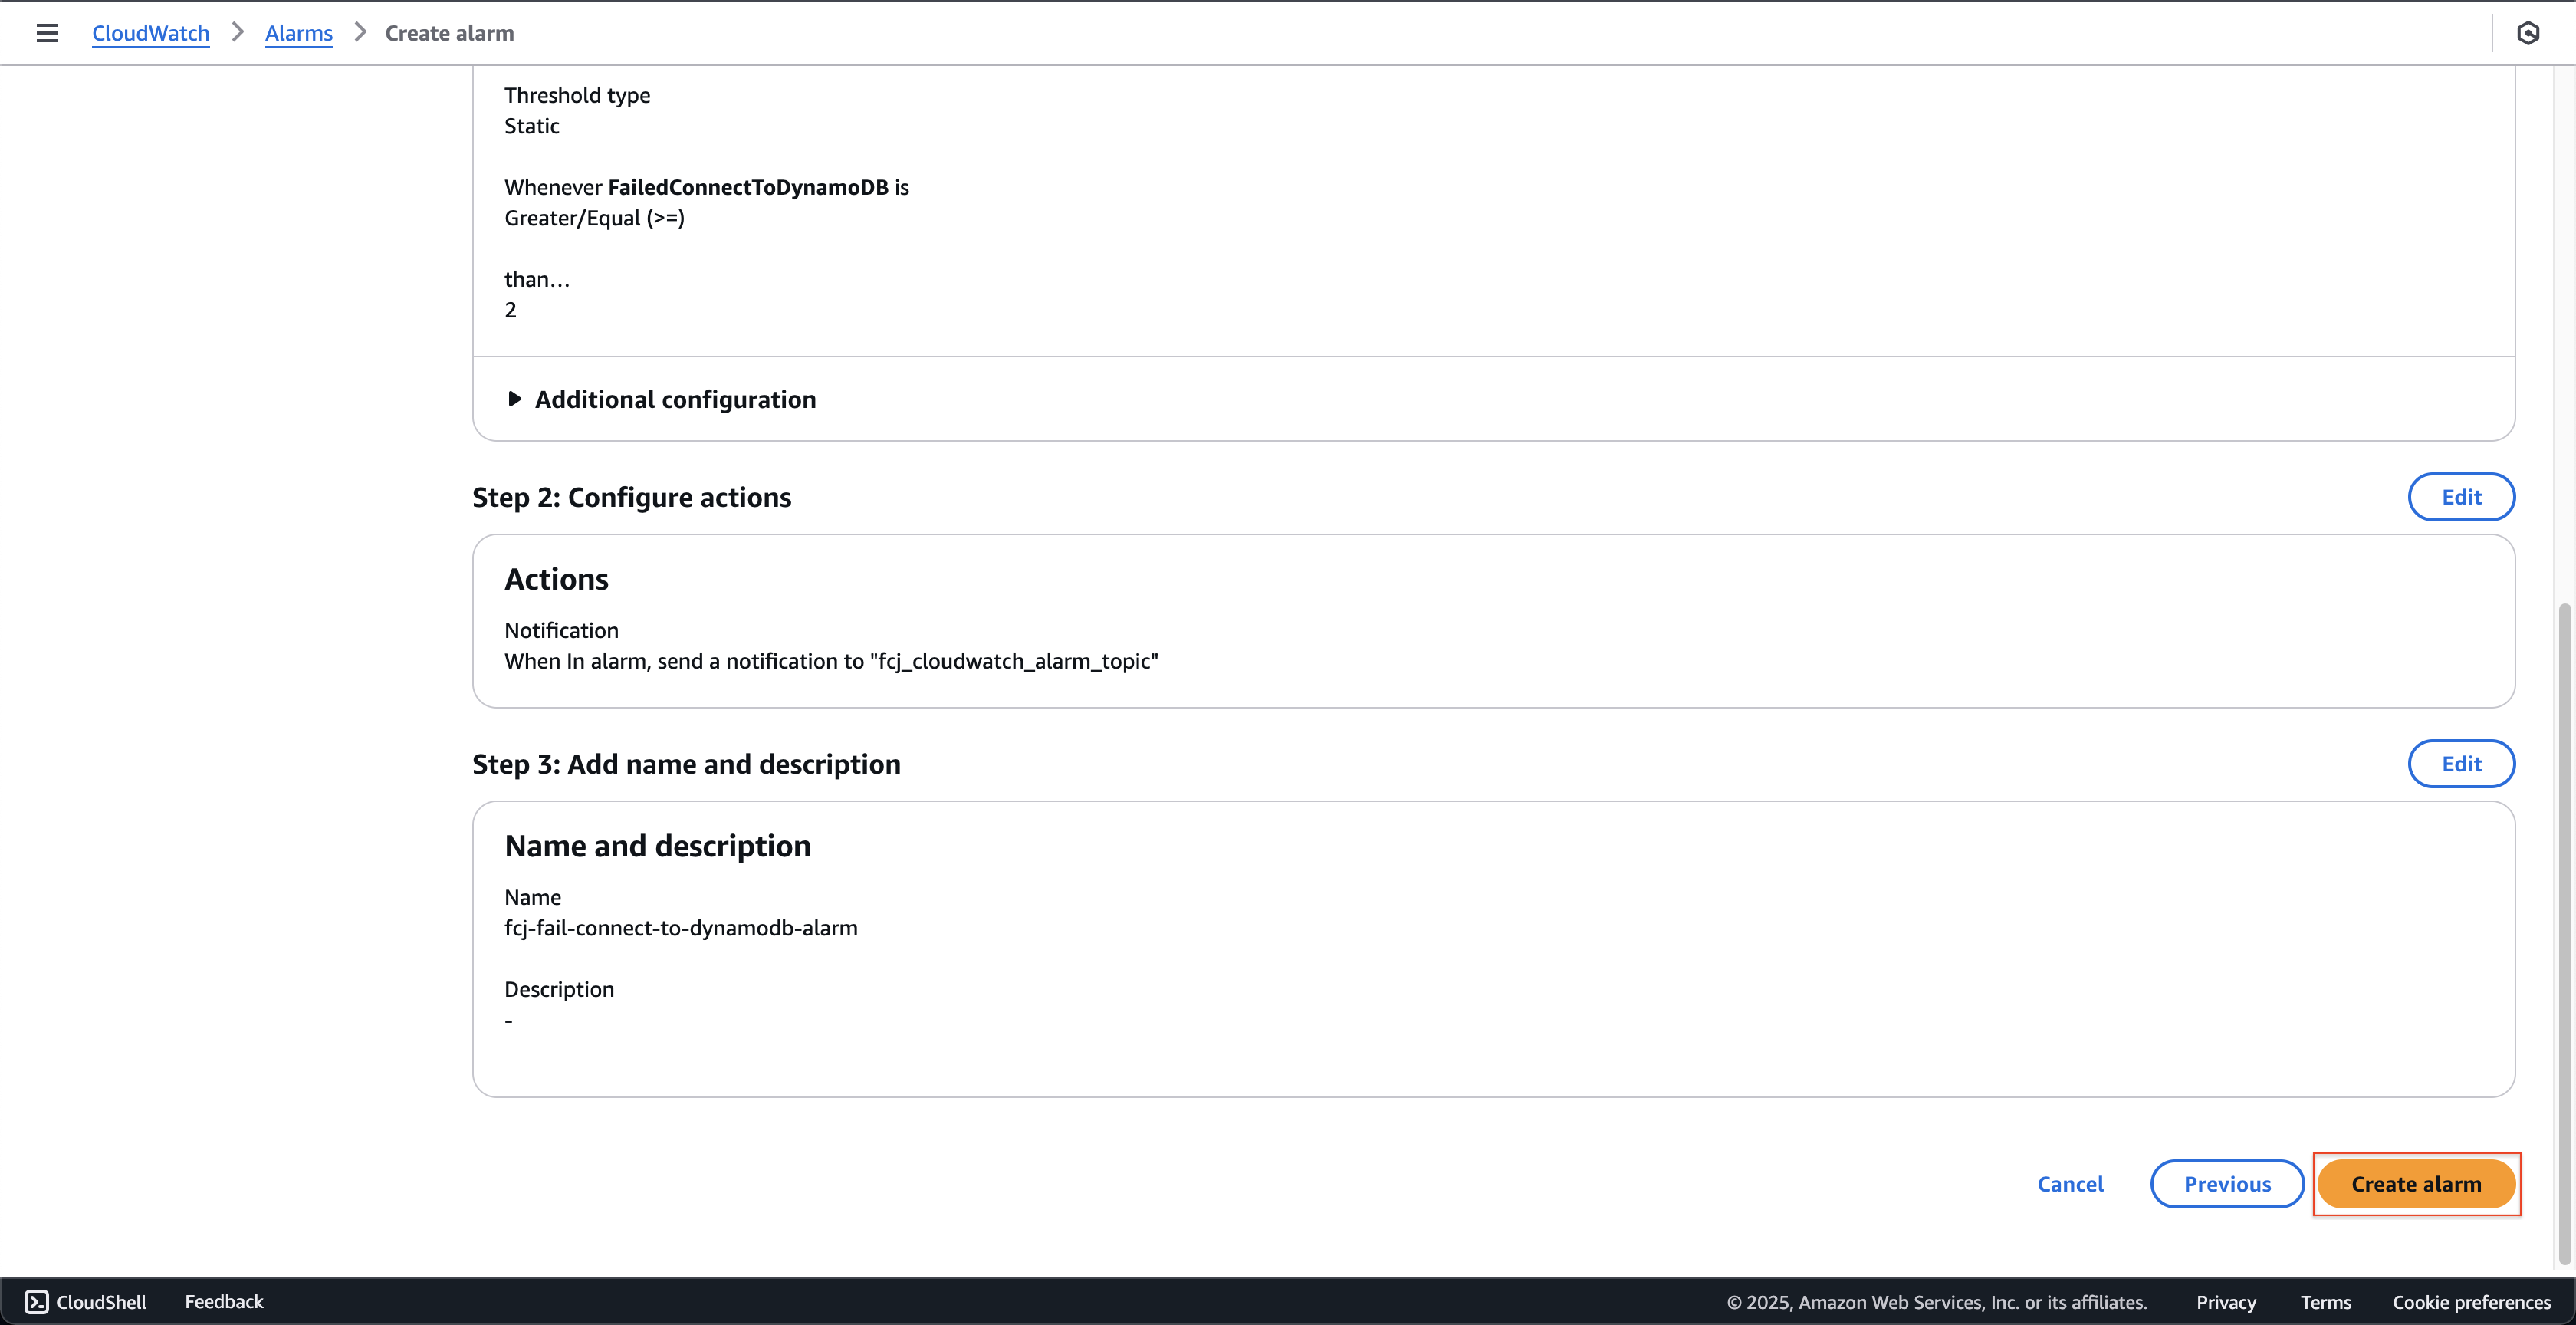
- Click the Create alarm button.
-
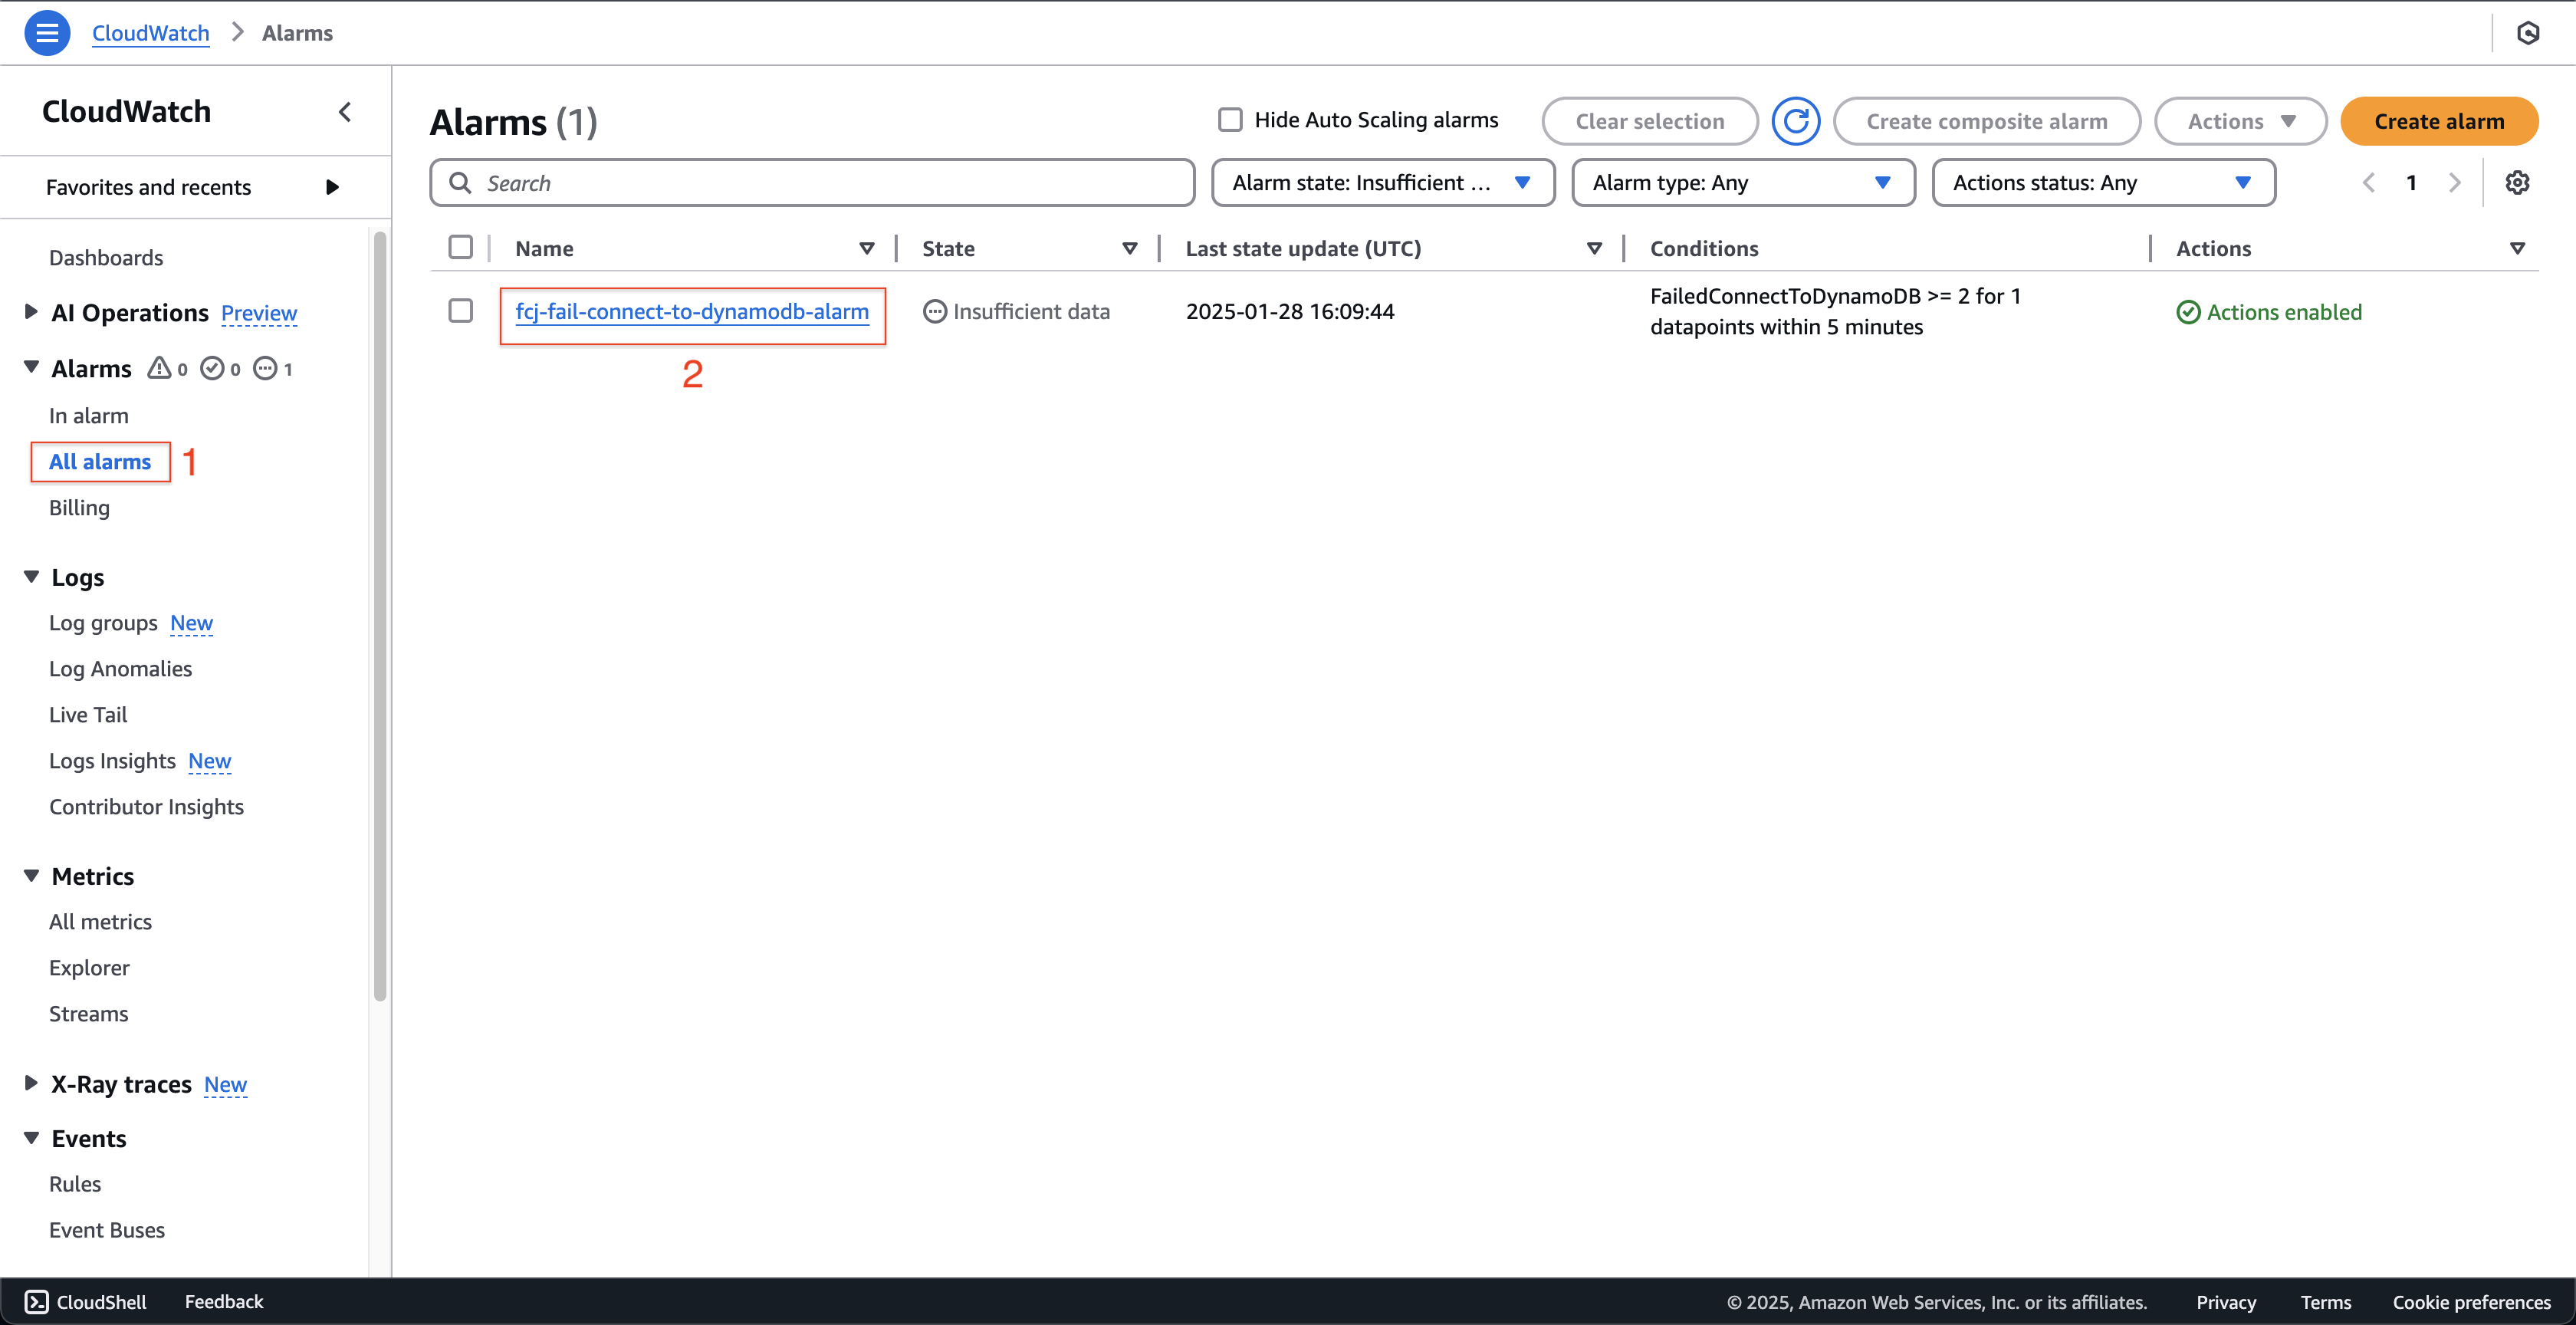
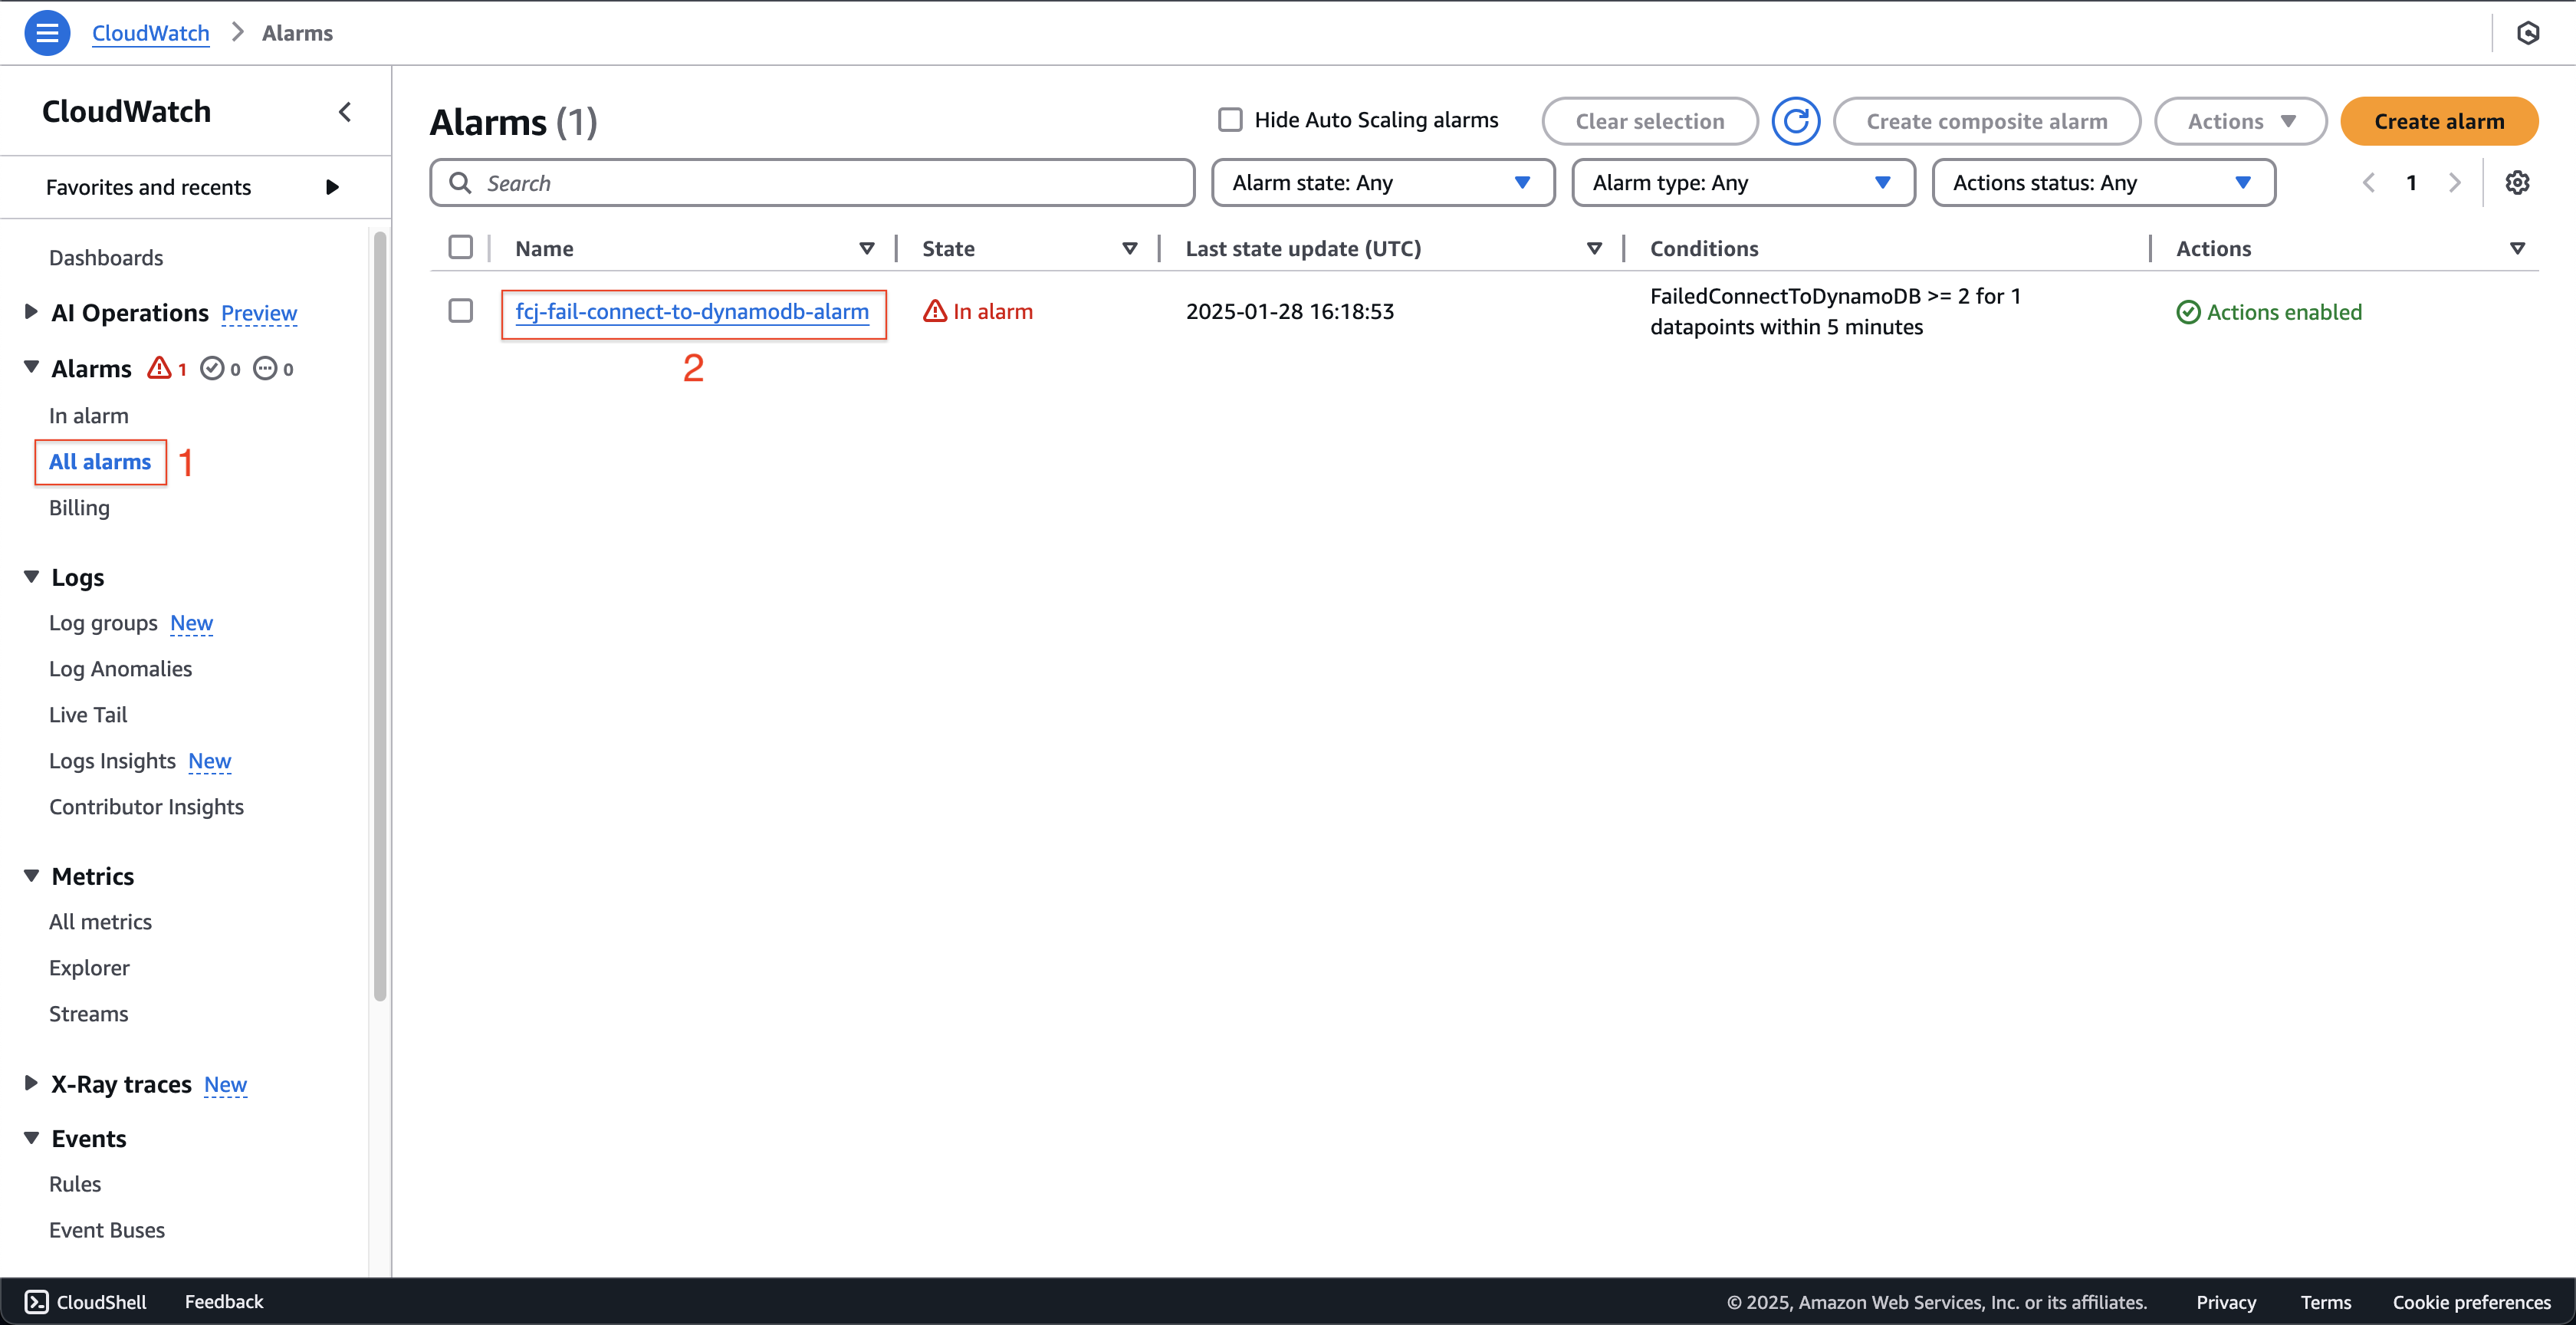
Open AWS CloudWatch console.
- Click the All alarms on the left menu.
- You can see the fcj-fail-connect-to-dynamodb-alarm that we created in the previous step.
-
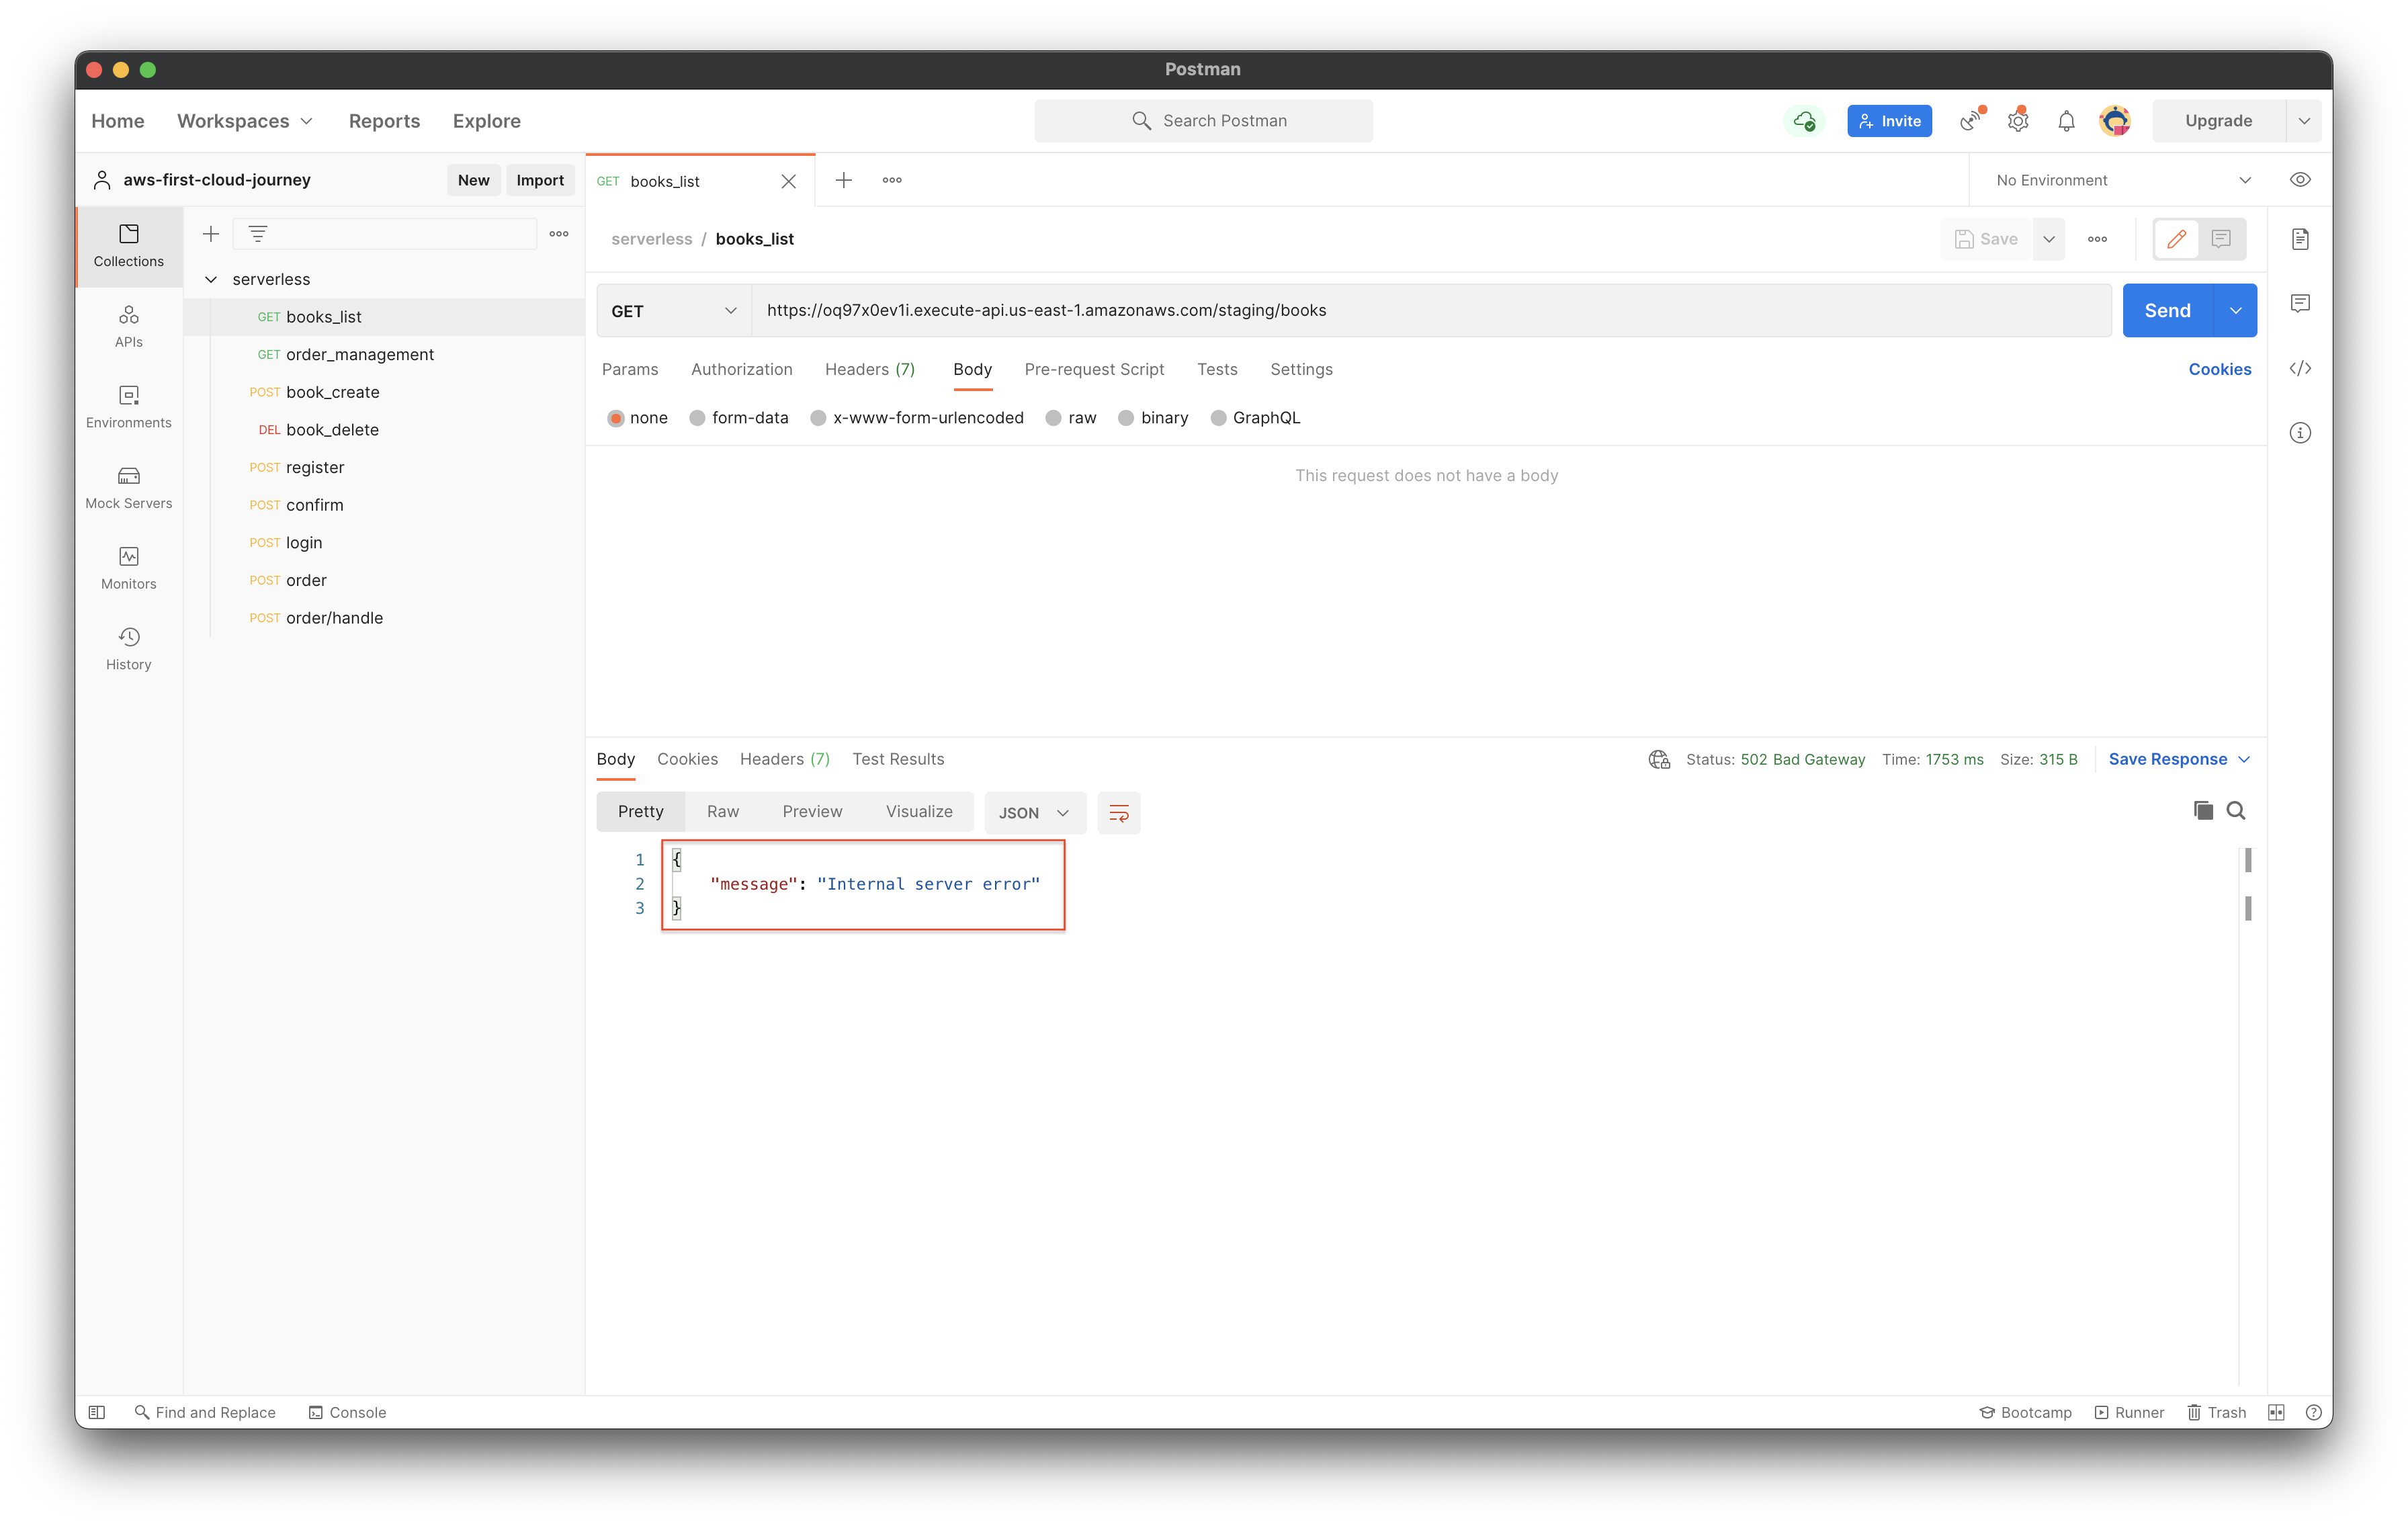
Open Postman to recall the api twice.
-
Open the email that you chose to receive the notification before.
- Find the email that is sent from no-reply@sns.amazonaws.com.
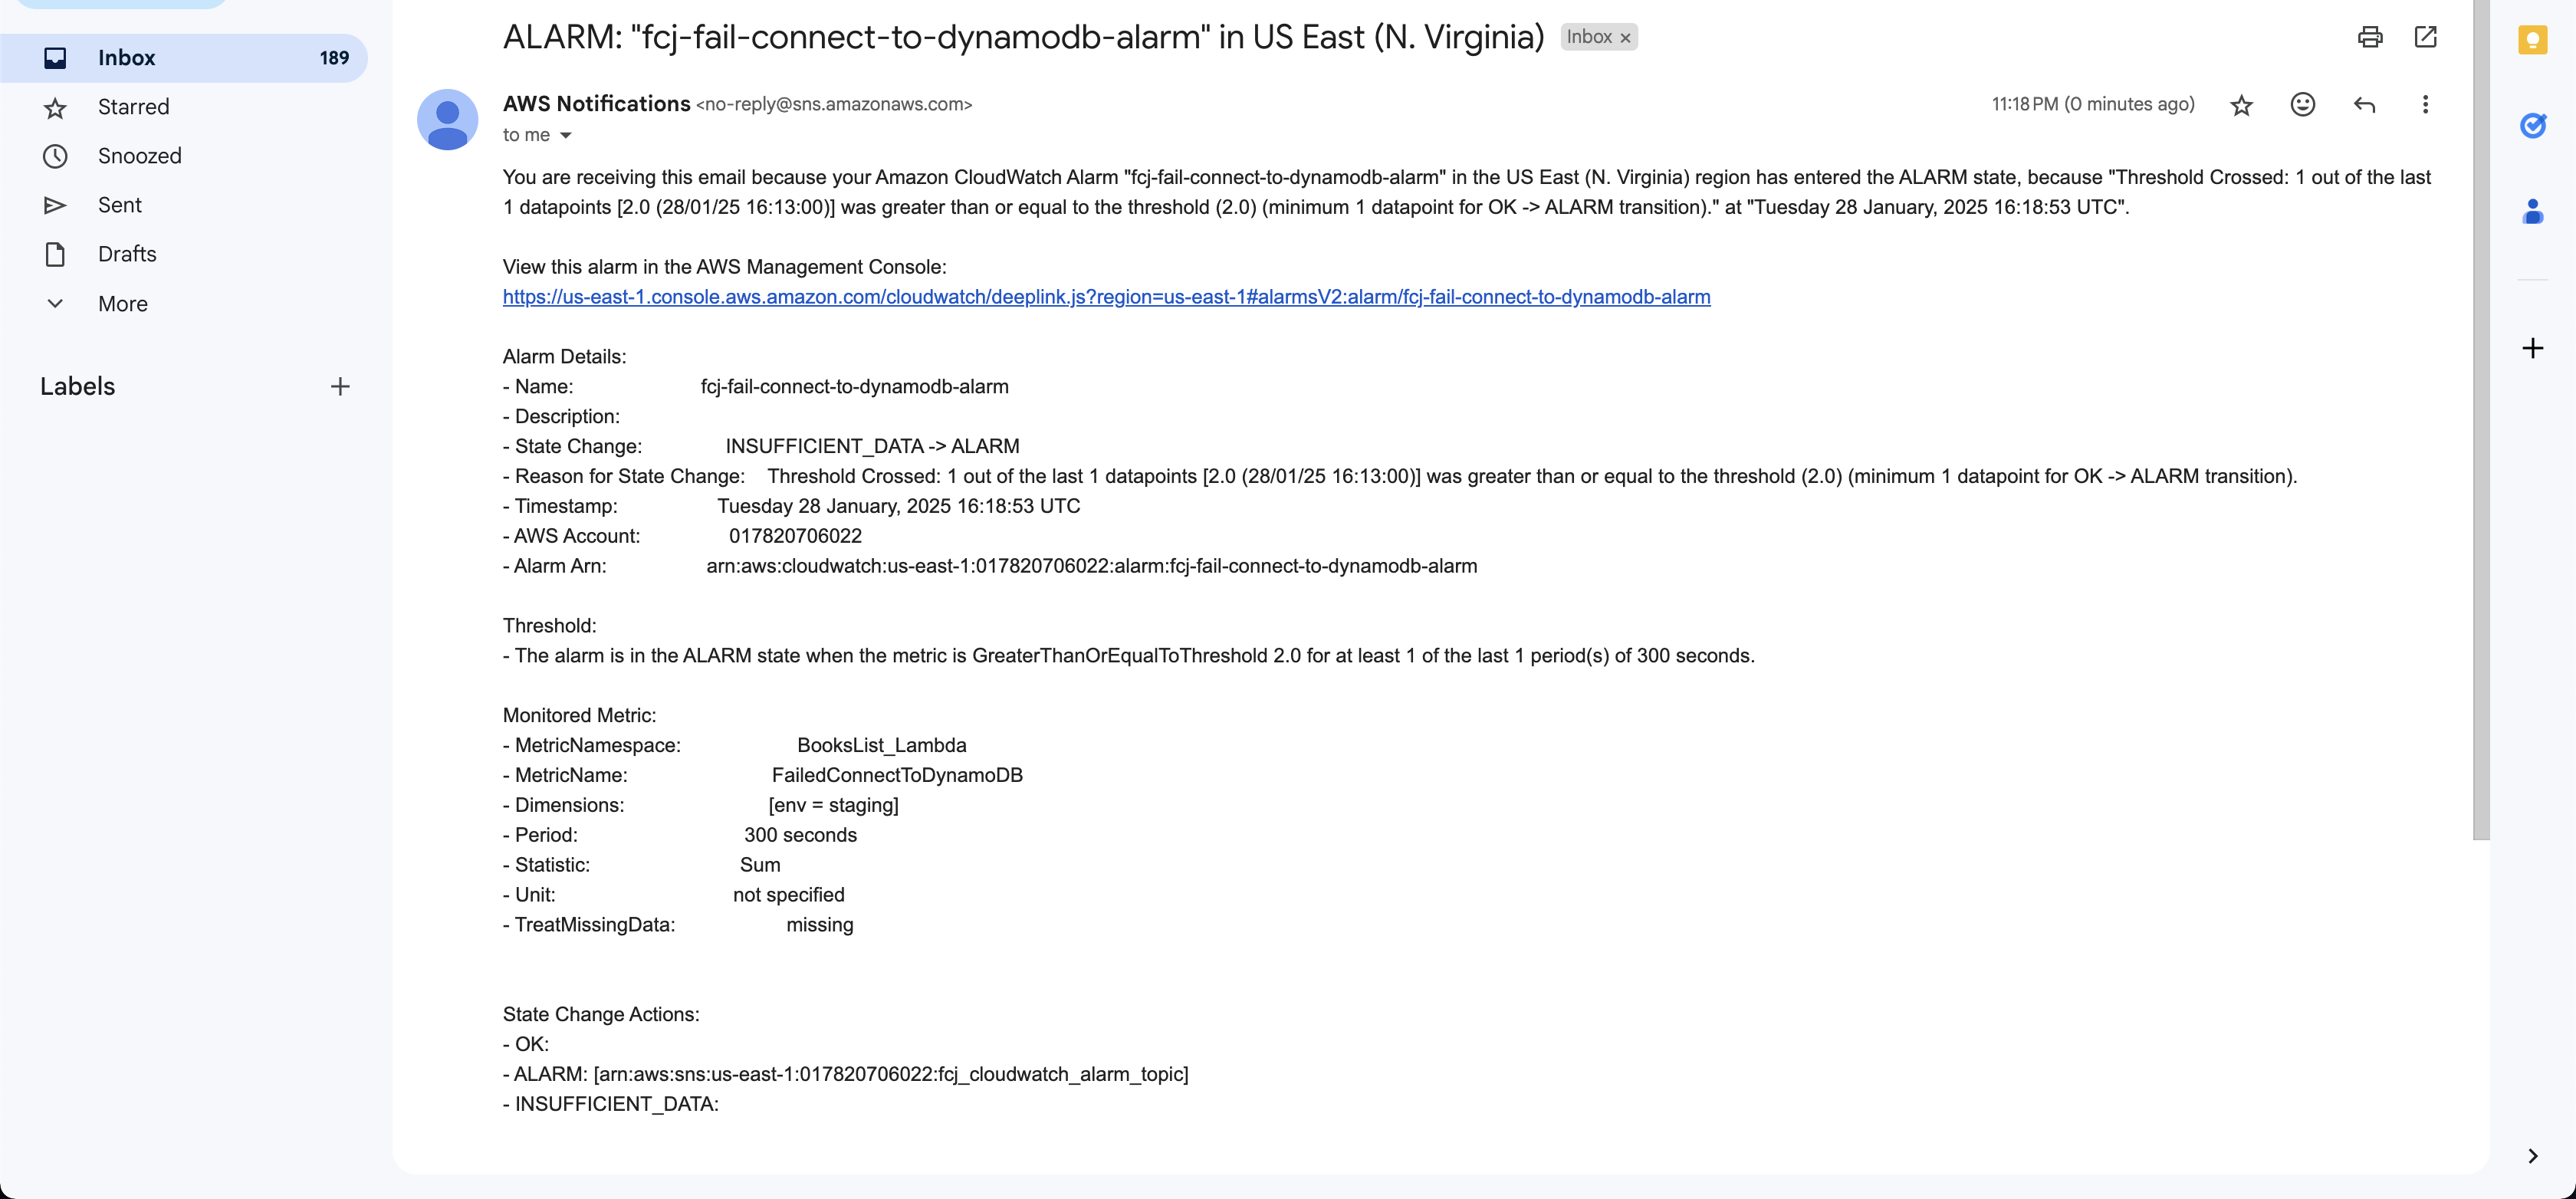
- Find the email that is sent from no-reply@sns.amazonaws.com.
-
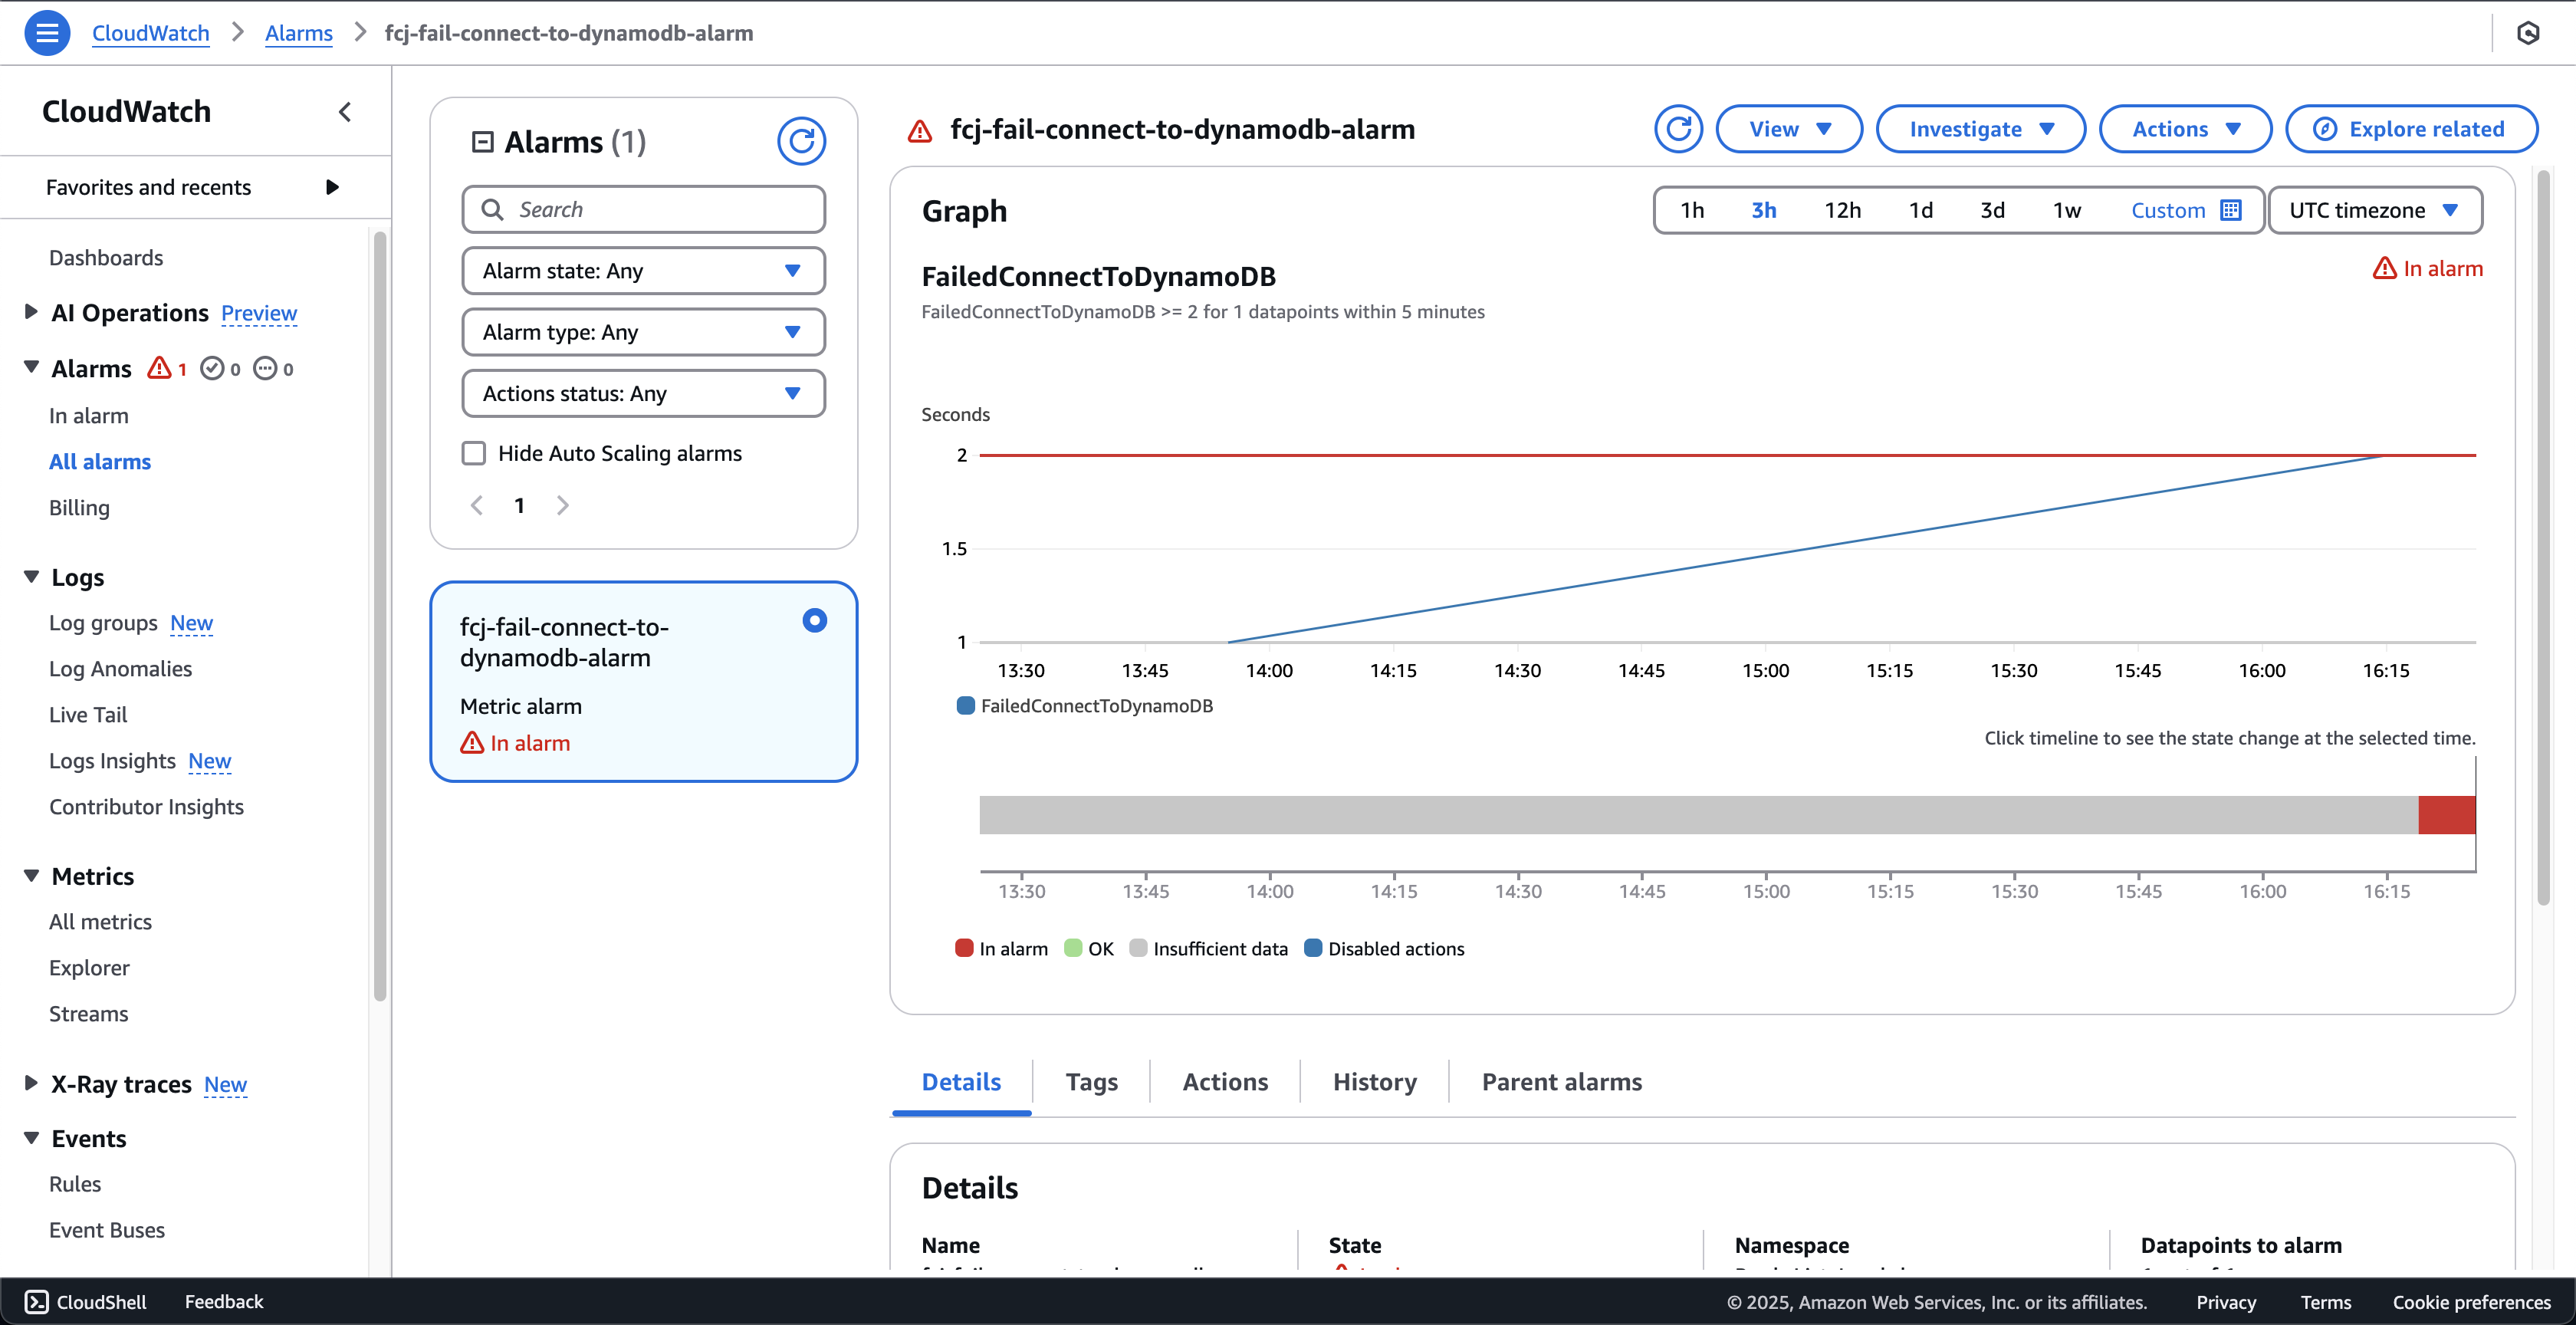
Back to AWS CloudWatch console.
- Click the All alarms on the left menu.
- Choose the fcj-fail-connect-to-dynamodb-alarm at Name.
- At fcj-fail-connect-to-dynamodb-alarm page, you can see the histogram of the metric is displayed.