Create custom metric
CloudWatch metric provides several metrics for Lambda functions such as the number of times the function is executed, the execution time of each time, error rates, and throttle count. To see the metrics of a certain function we do the following steps.
-
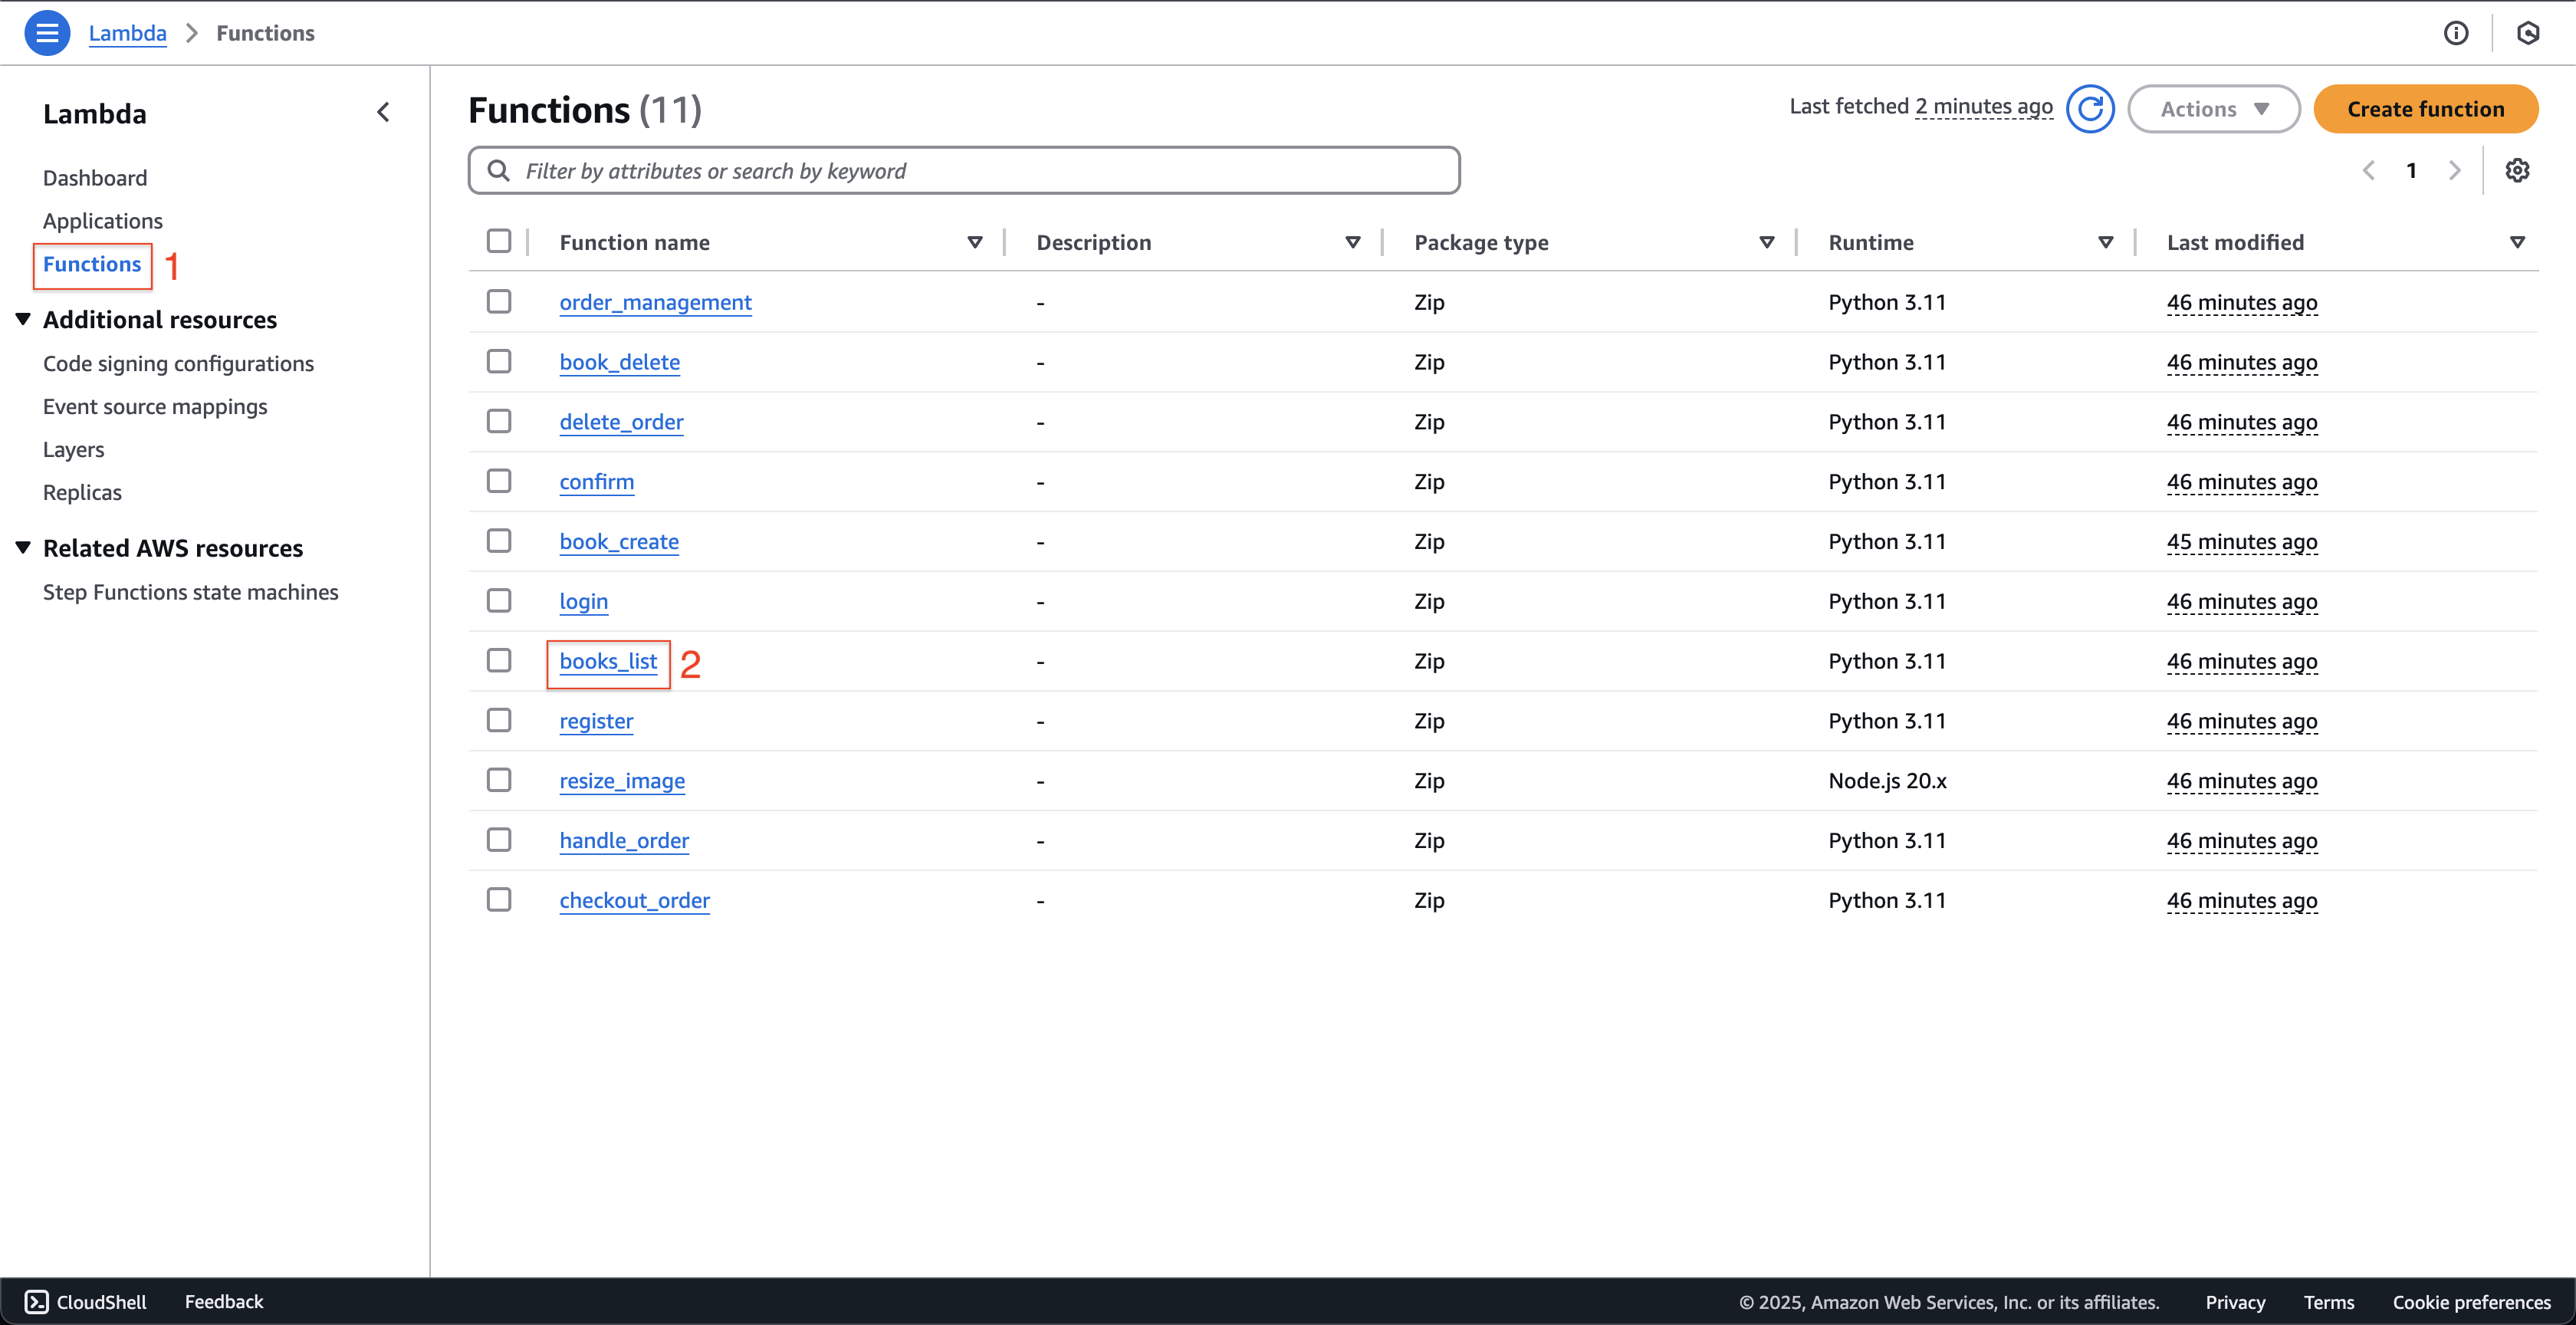
Open AWS Lambda console.
- Click Functions on the left menu.
- Choose the books_list function.
-
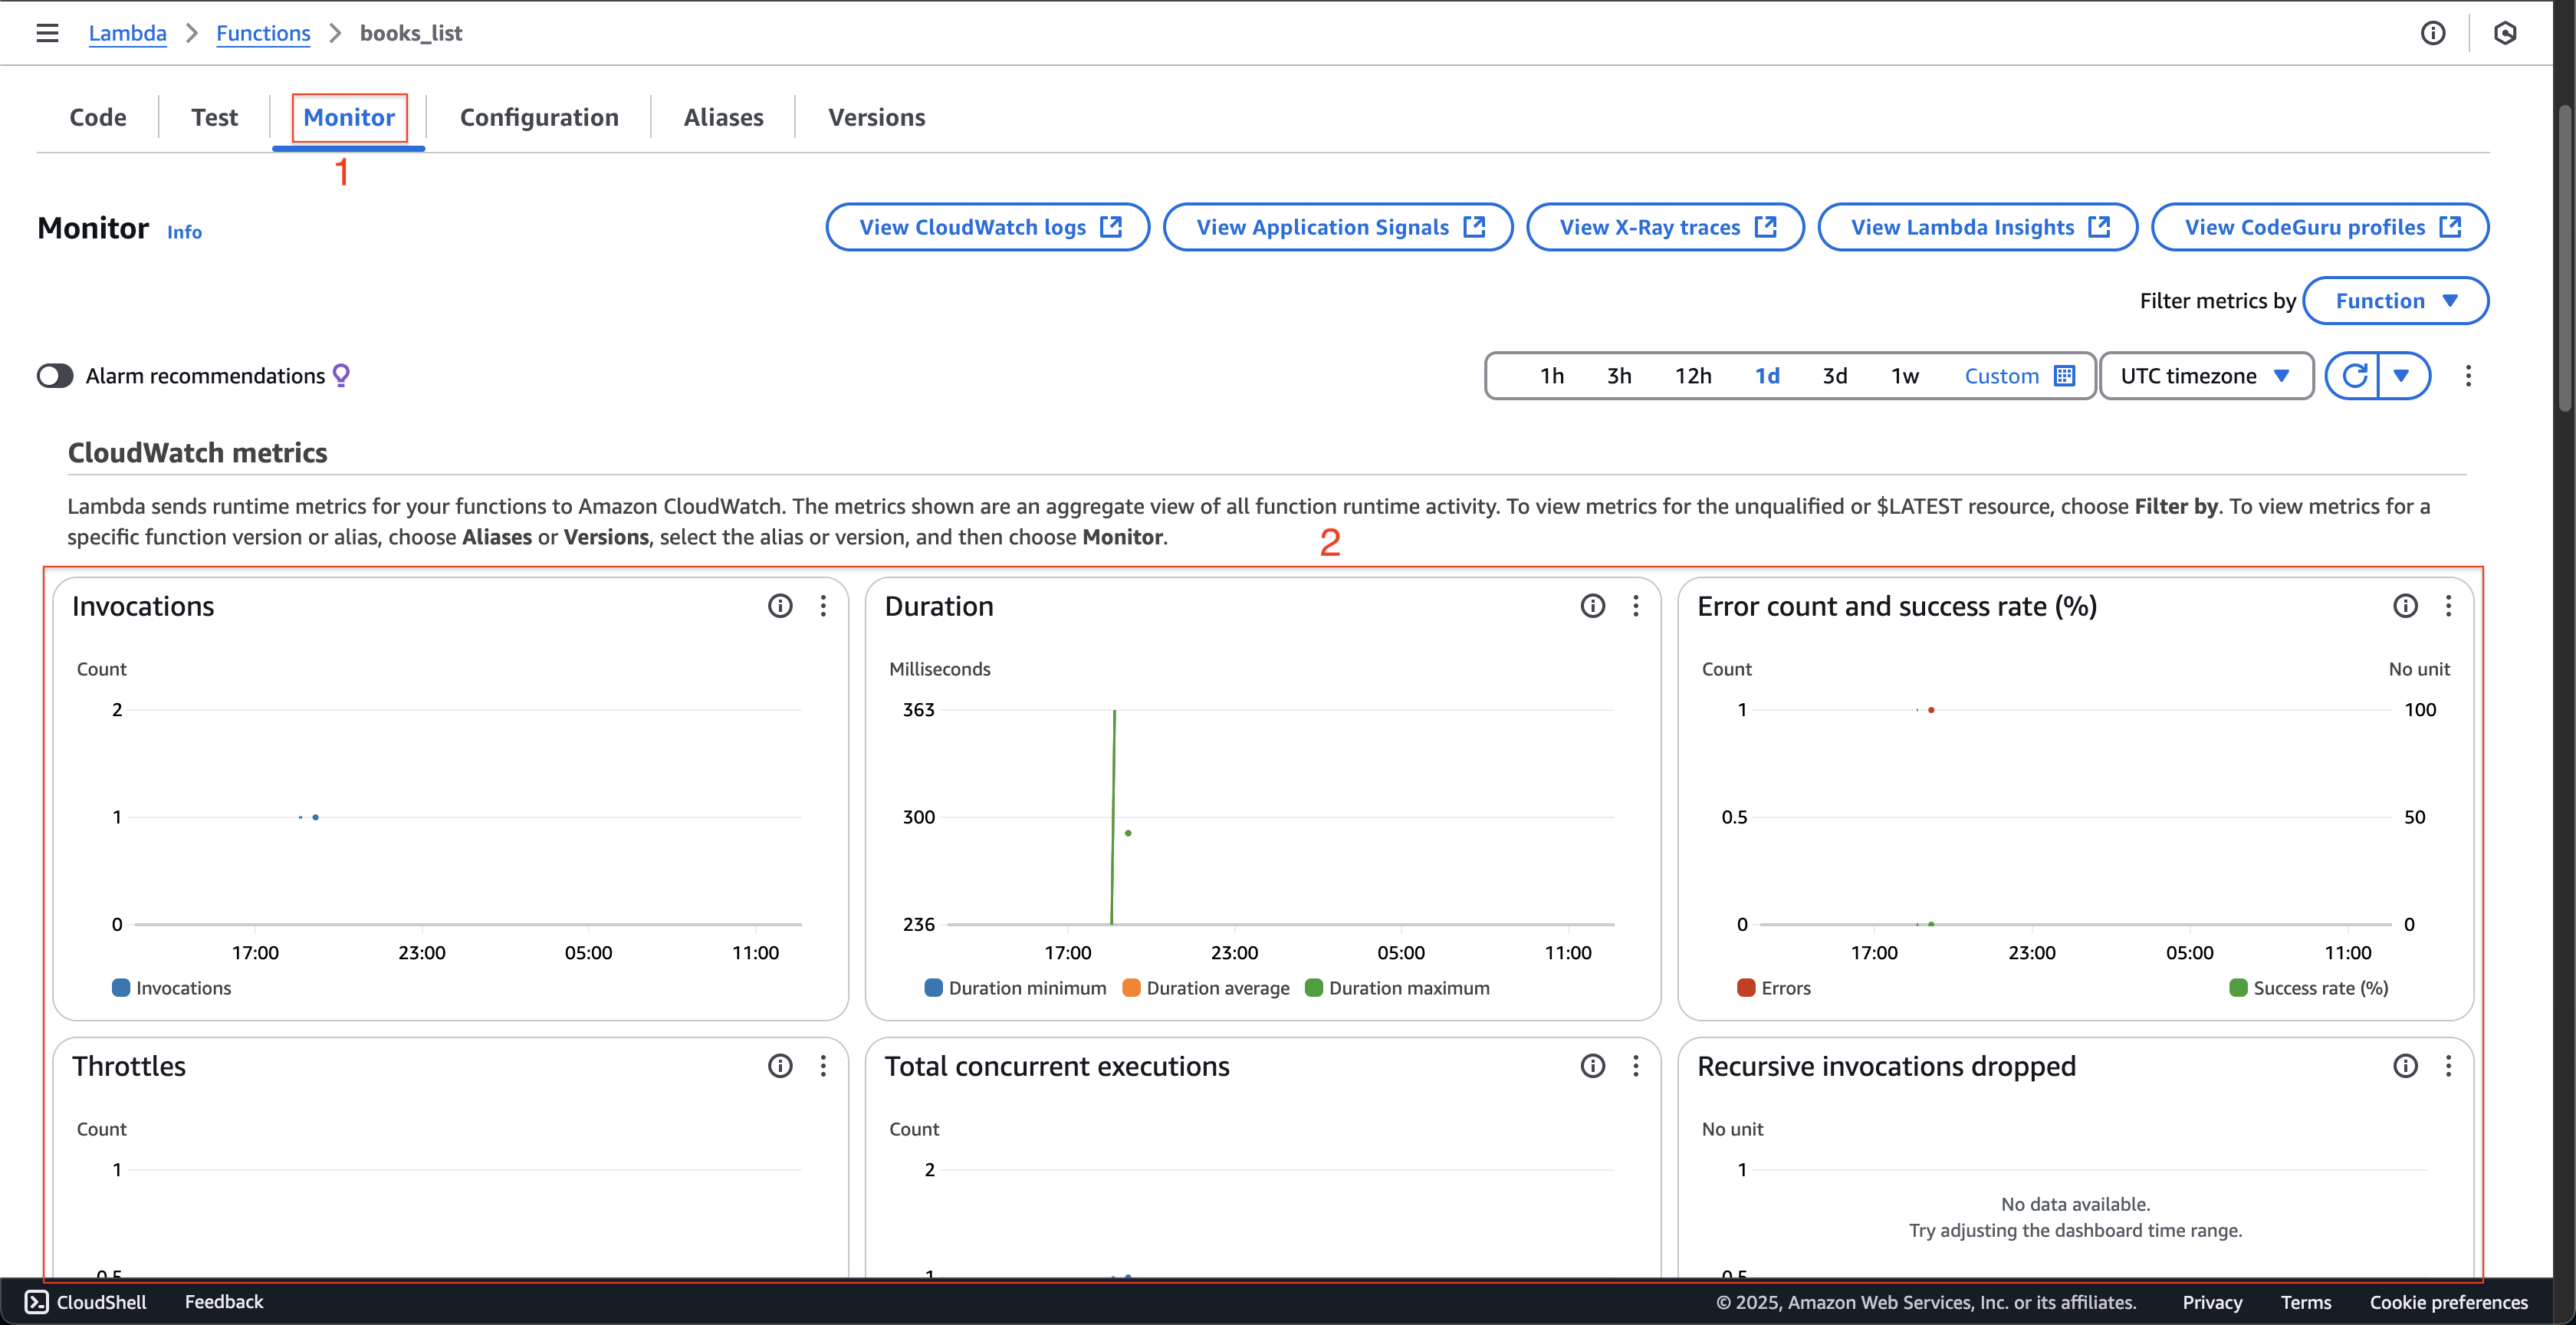
At books_list page.
- Click the Monitor tab.
- You can see the CloudWatch metrics are displayed.
-
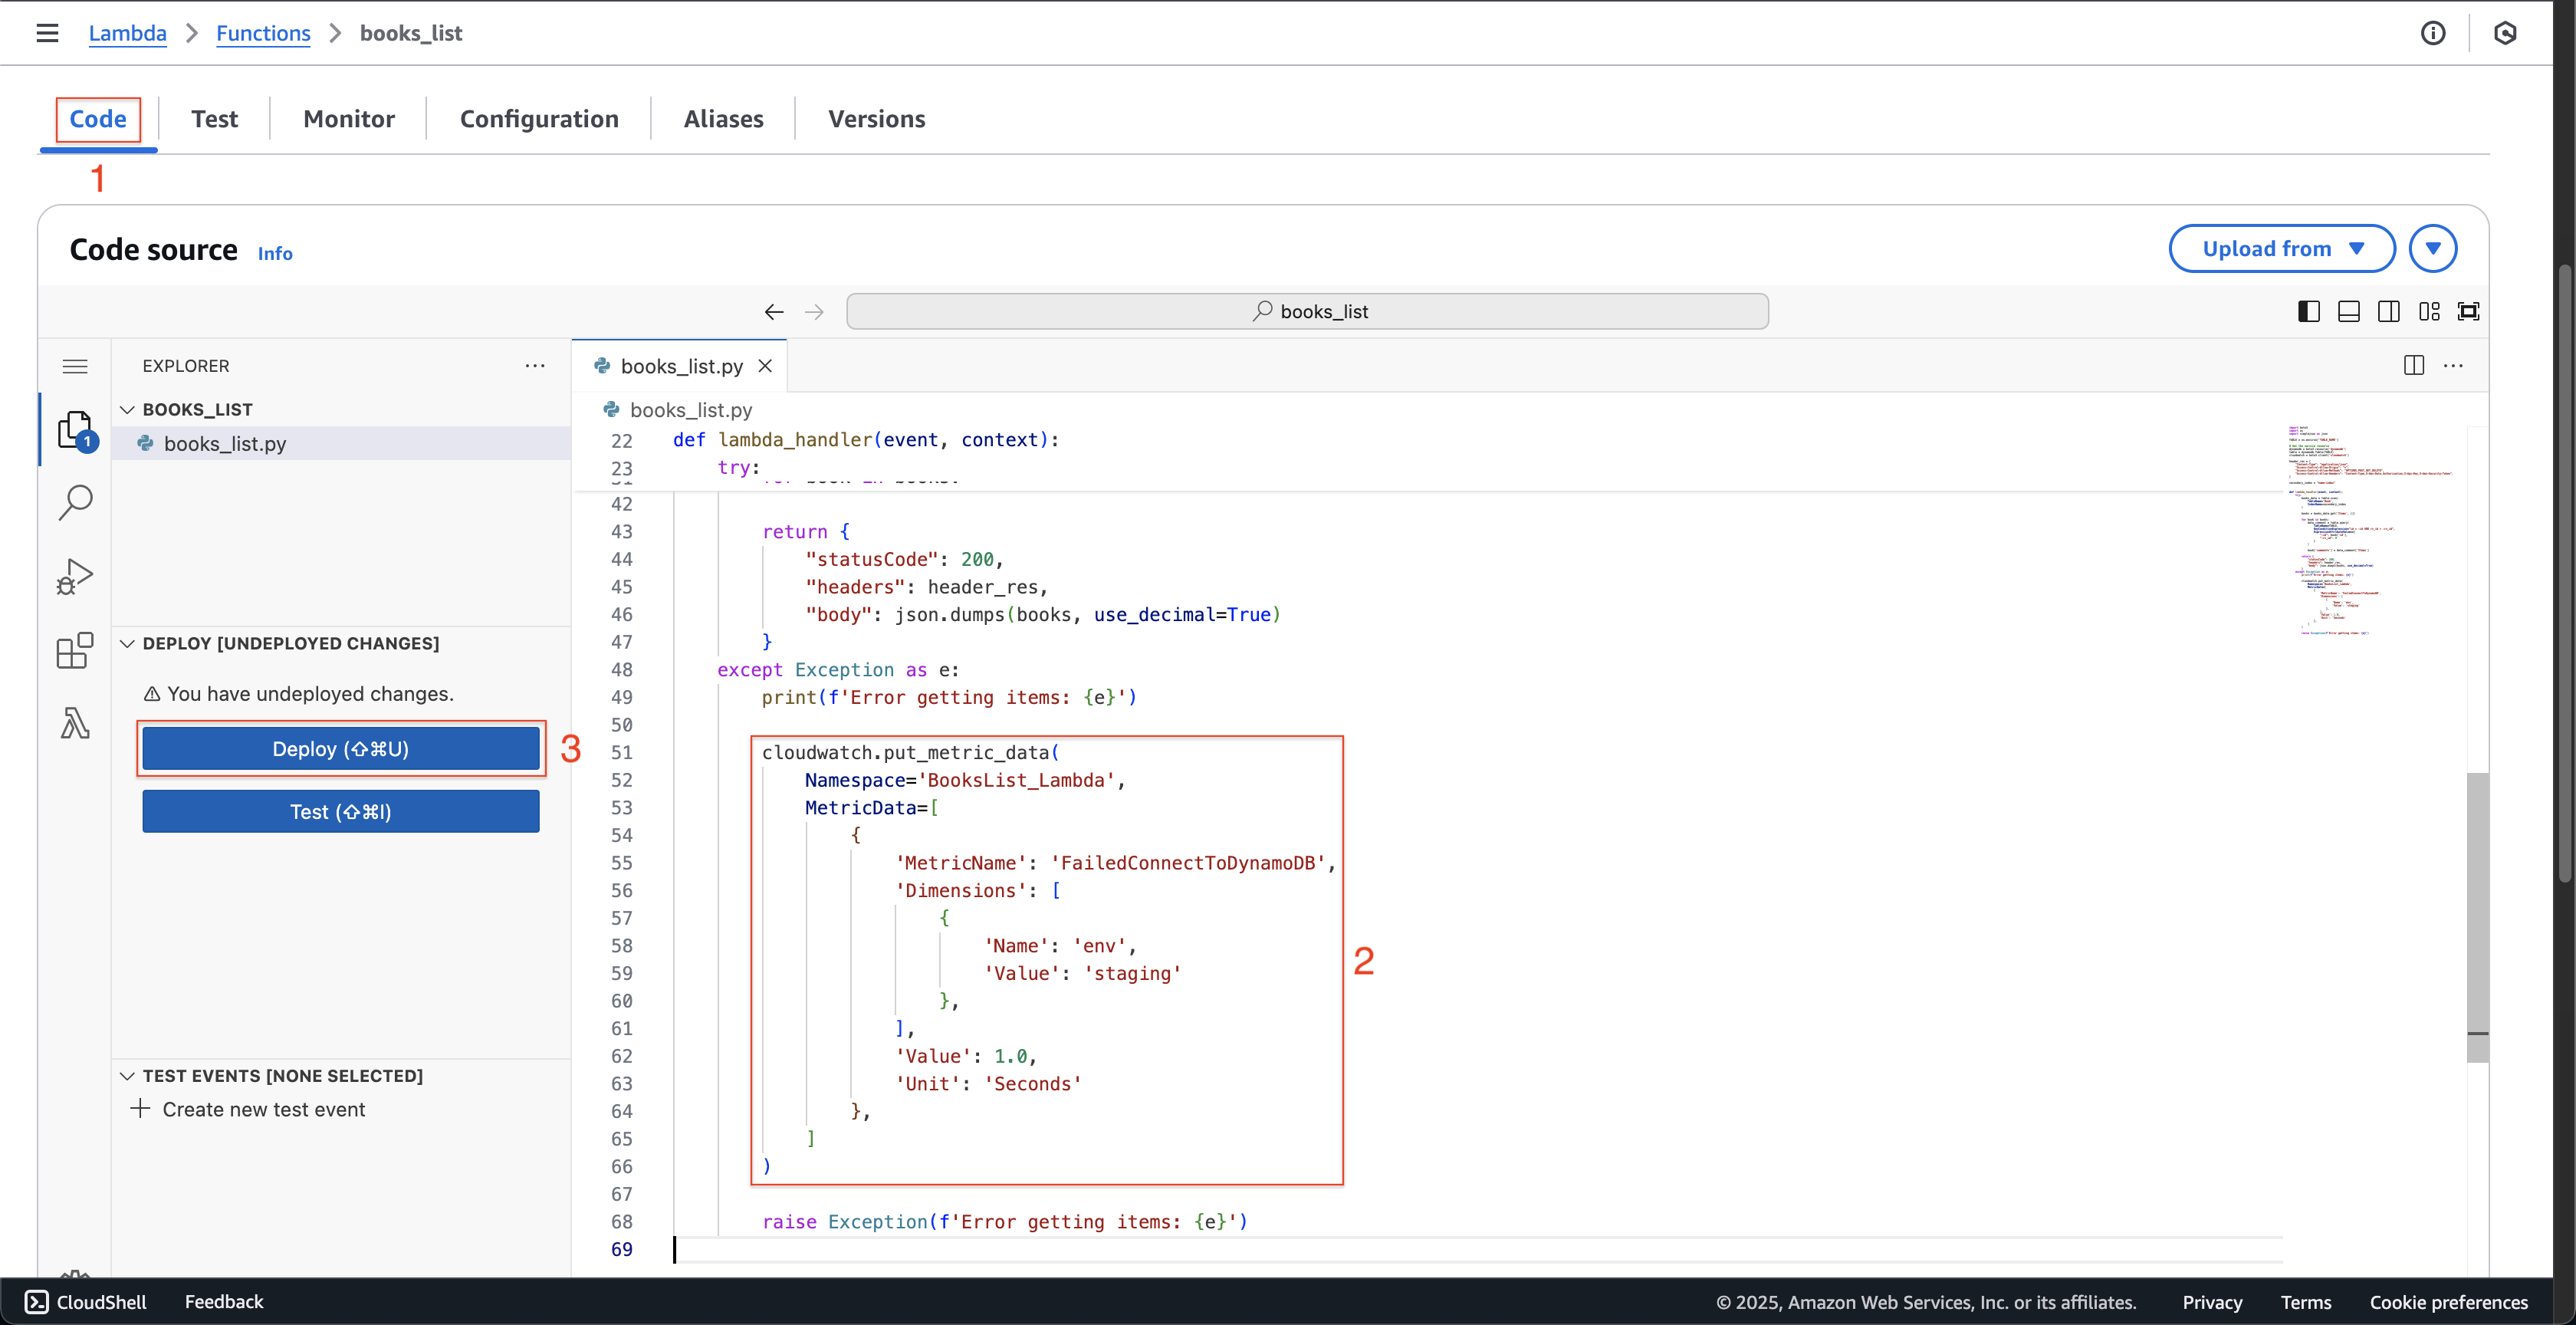
Next, we will create a new custom metric that sums up the number of hits to DynamoDB that fail. At books_list page.
-
Click the Code tab.
-
Copy the following code.
import boto3 import os import simplejson as json TABLE = os.environ['TABLE_NAME'] # Get the service resource dynamodb = boto3.resource('dynamodb') table = dynamodb.Table(TABLE) cloudwatch = boto3.client('cloudwatch') header_res = { "Content-Type": "application/json", "Access-Control-Allow-Origin": "*", "Access-Control-Allow-Methods": "OPTIONS,POST,GET,DELETE", "Access-Control-Allow-Headers": "Content-Type,X-Amz-Date,Authorization,X-Api-Key,X-Amz-Security-Token", } secondary_index = "name-index" def lambda_handler(event, context): try: books_data = table.scan( TableName='Book', IndexName=secondary_index ) books = books_data.get('Items', []) for book in books: data_comment = table.query( TableName=TABLE, KeyConditionExpression="id = :id AND rv_id > :rv_id", ExpressionAttributeValues={ ":id": book['id'], ":rv_id": 0 } ) book['comments'] = data_comment['Items'] return { "statusCode": 200, "headers": header_res, "body": json.dumps(books, use_decimal=True) } except Exception as e: print(f'Error getting items: {e}') cloudwatch.put_metric_data( Namespace='BooksList_Lambda', MetricData=[ { 'MetricName': 'FailedConnectToDynamoDB', 'Dimensions': [ { 'Name': 'env', 'Value': 'staging' }, ], 'Value': 1.0, 'Unit': 'Seconds' }, ] ) raise Exception(f'Error getting items: {e}') -
Click the Deploy button.
-
-
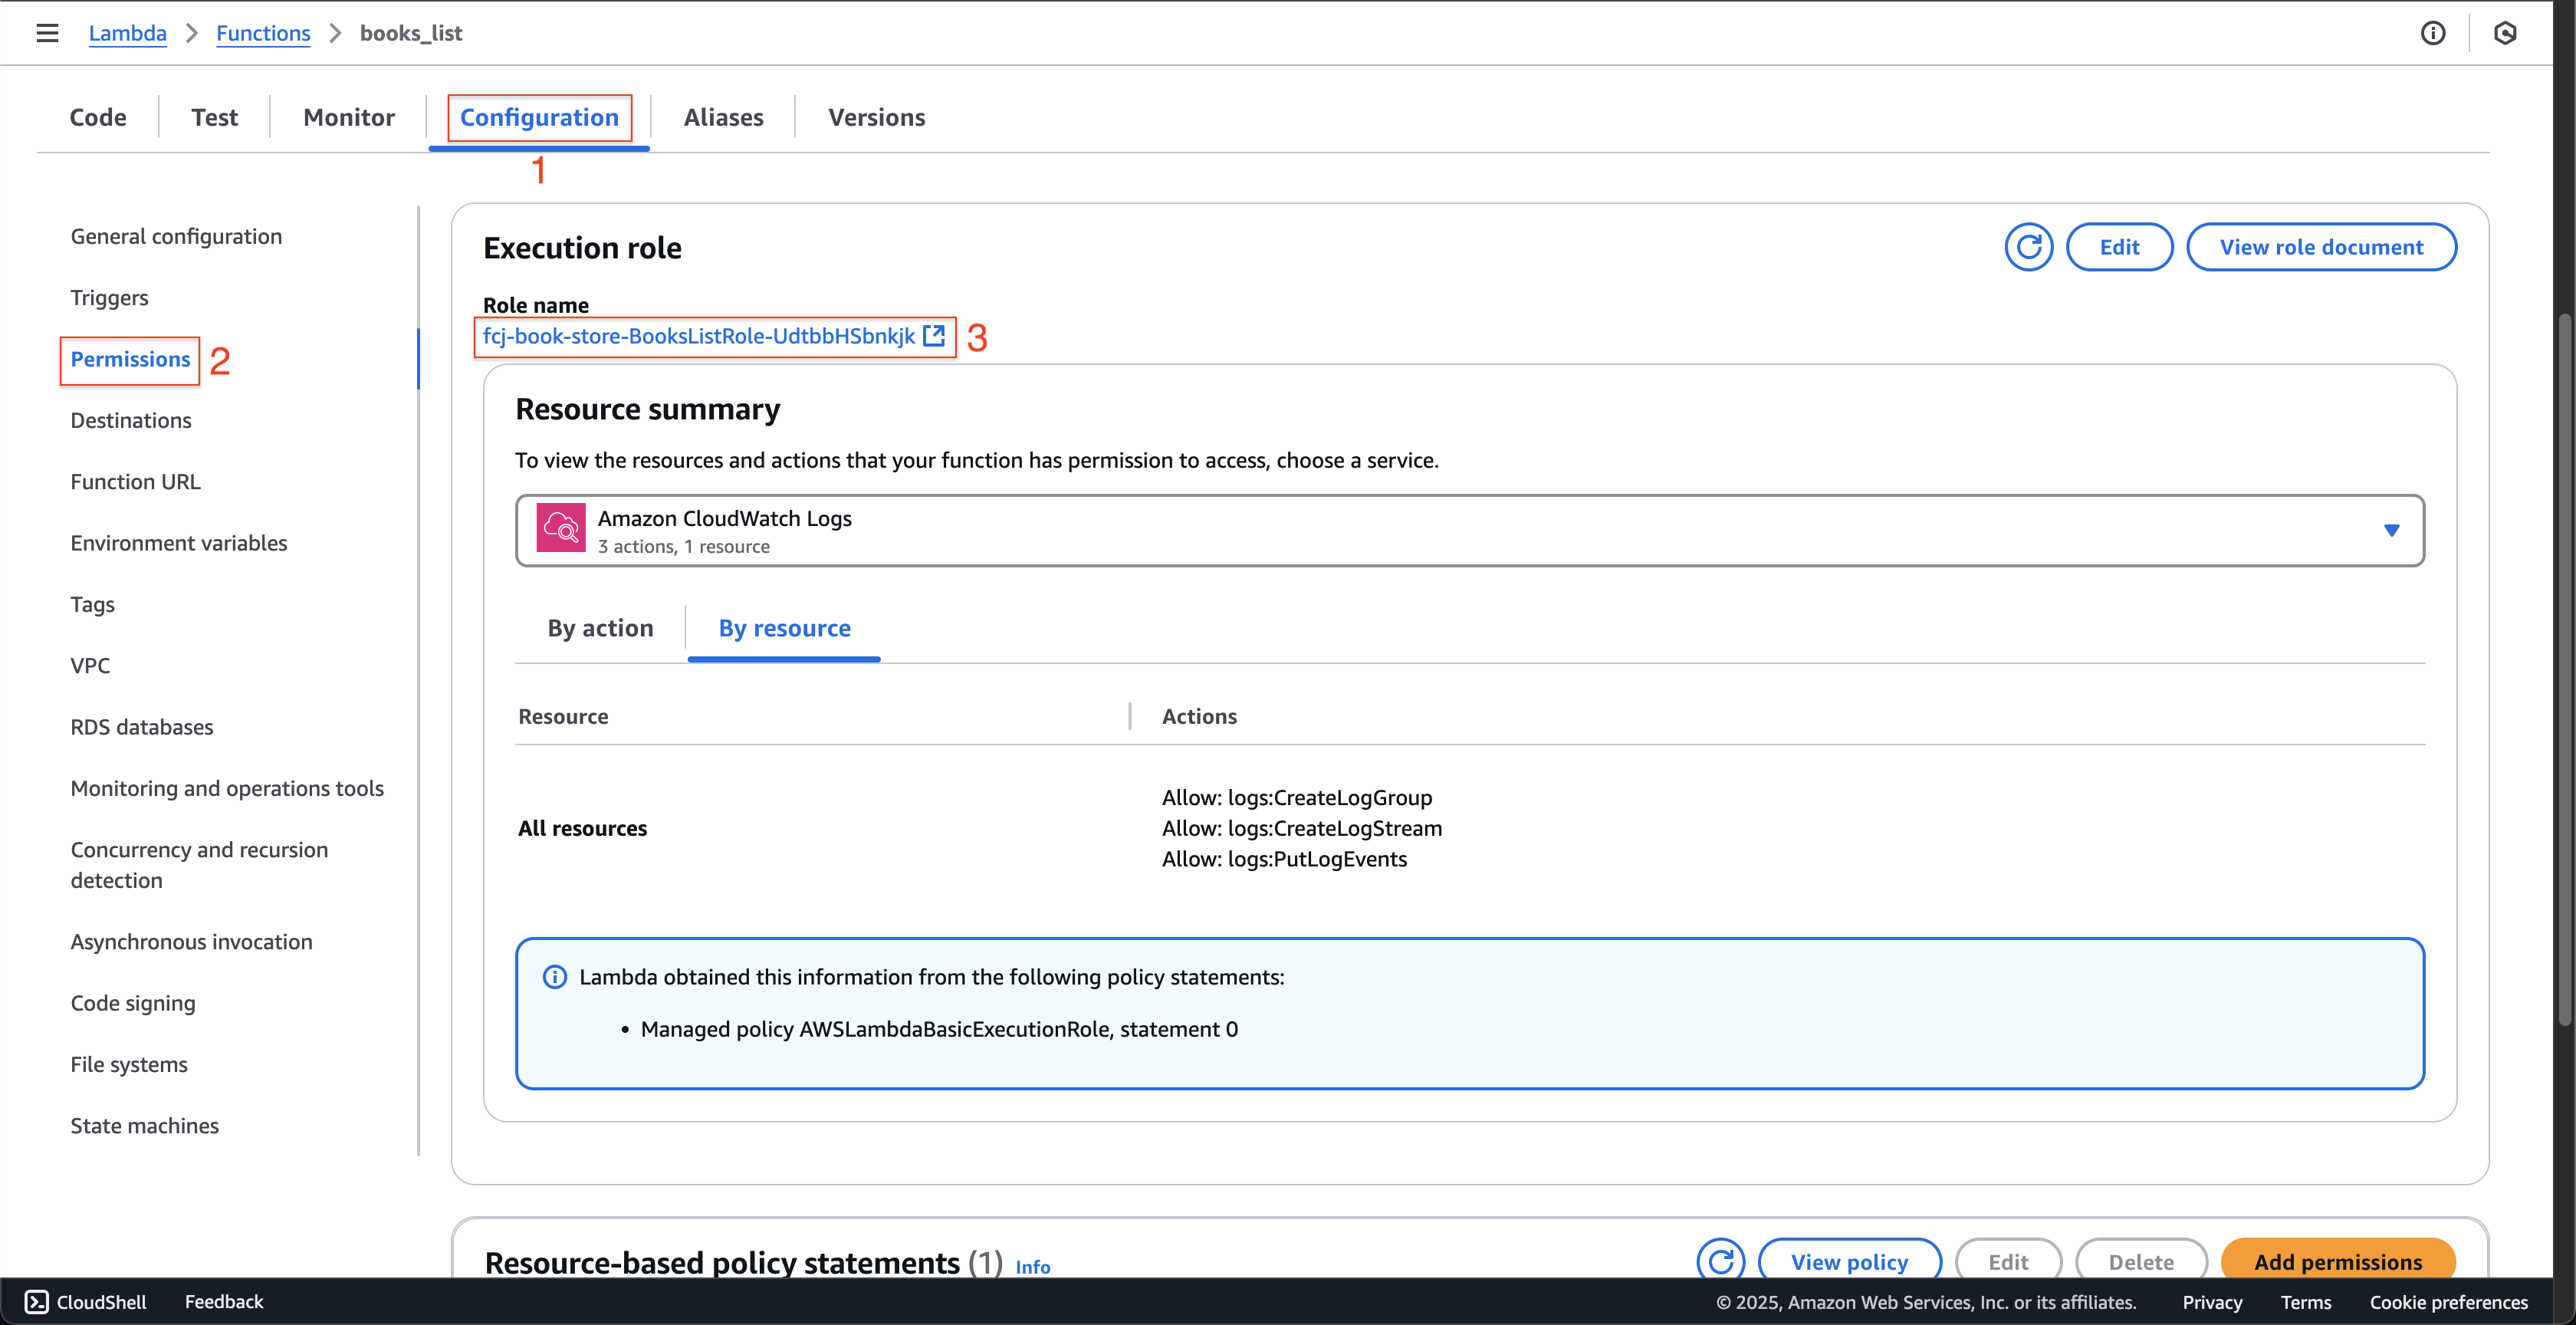
At books_list page.
- Click the Configuration tab.
- Click the Permissions on the left menu.
- Click the fcj-book-store-BooksListRole-… at Role name.
-
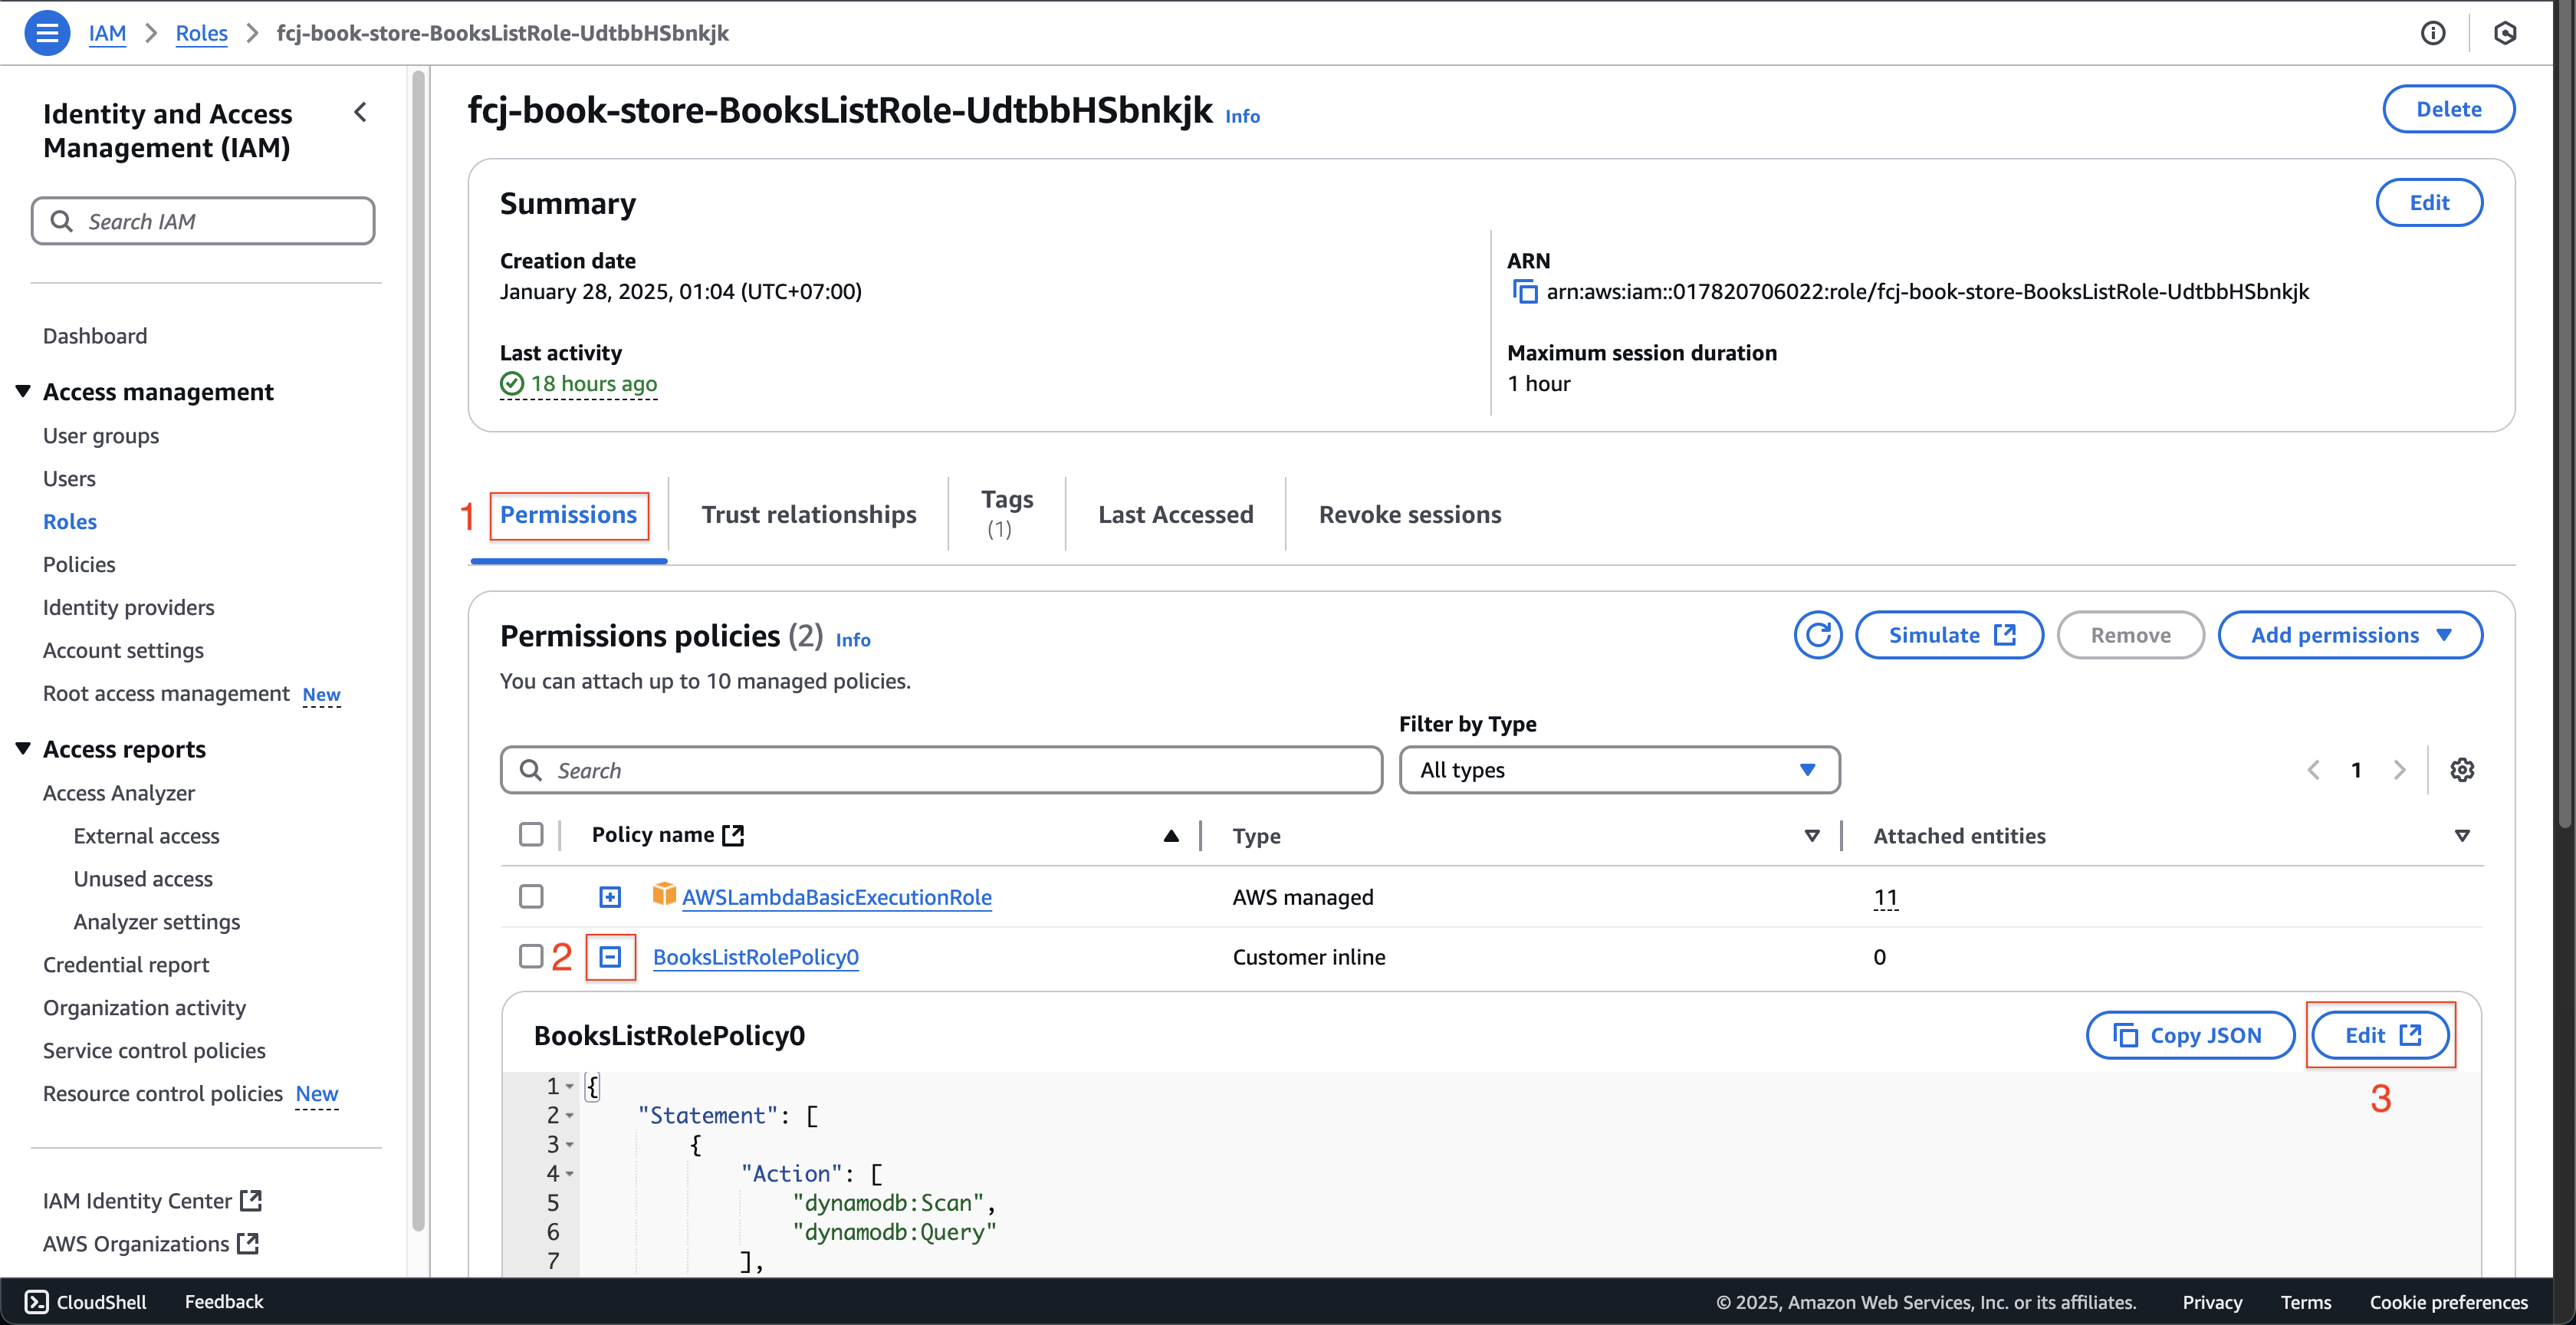
At fcj-book-store-BooksListRole-… page.
- Click the Permissions tab.
- Click the + at BooksListRolePolicy0 Policy name.
- Click the Edit button.
-
At Step 1: Modify permissions in BooksListRolePolicy0 page.
-
Click the JSON tab.
-
Copy the following code to the Policy editor.
{
    "Sid": "VisualEditor0",
    "Effect": "Allow",
    "Action": "cloudwatch:PutMetricData",
    "Resource": "*"
},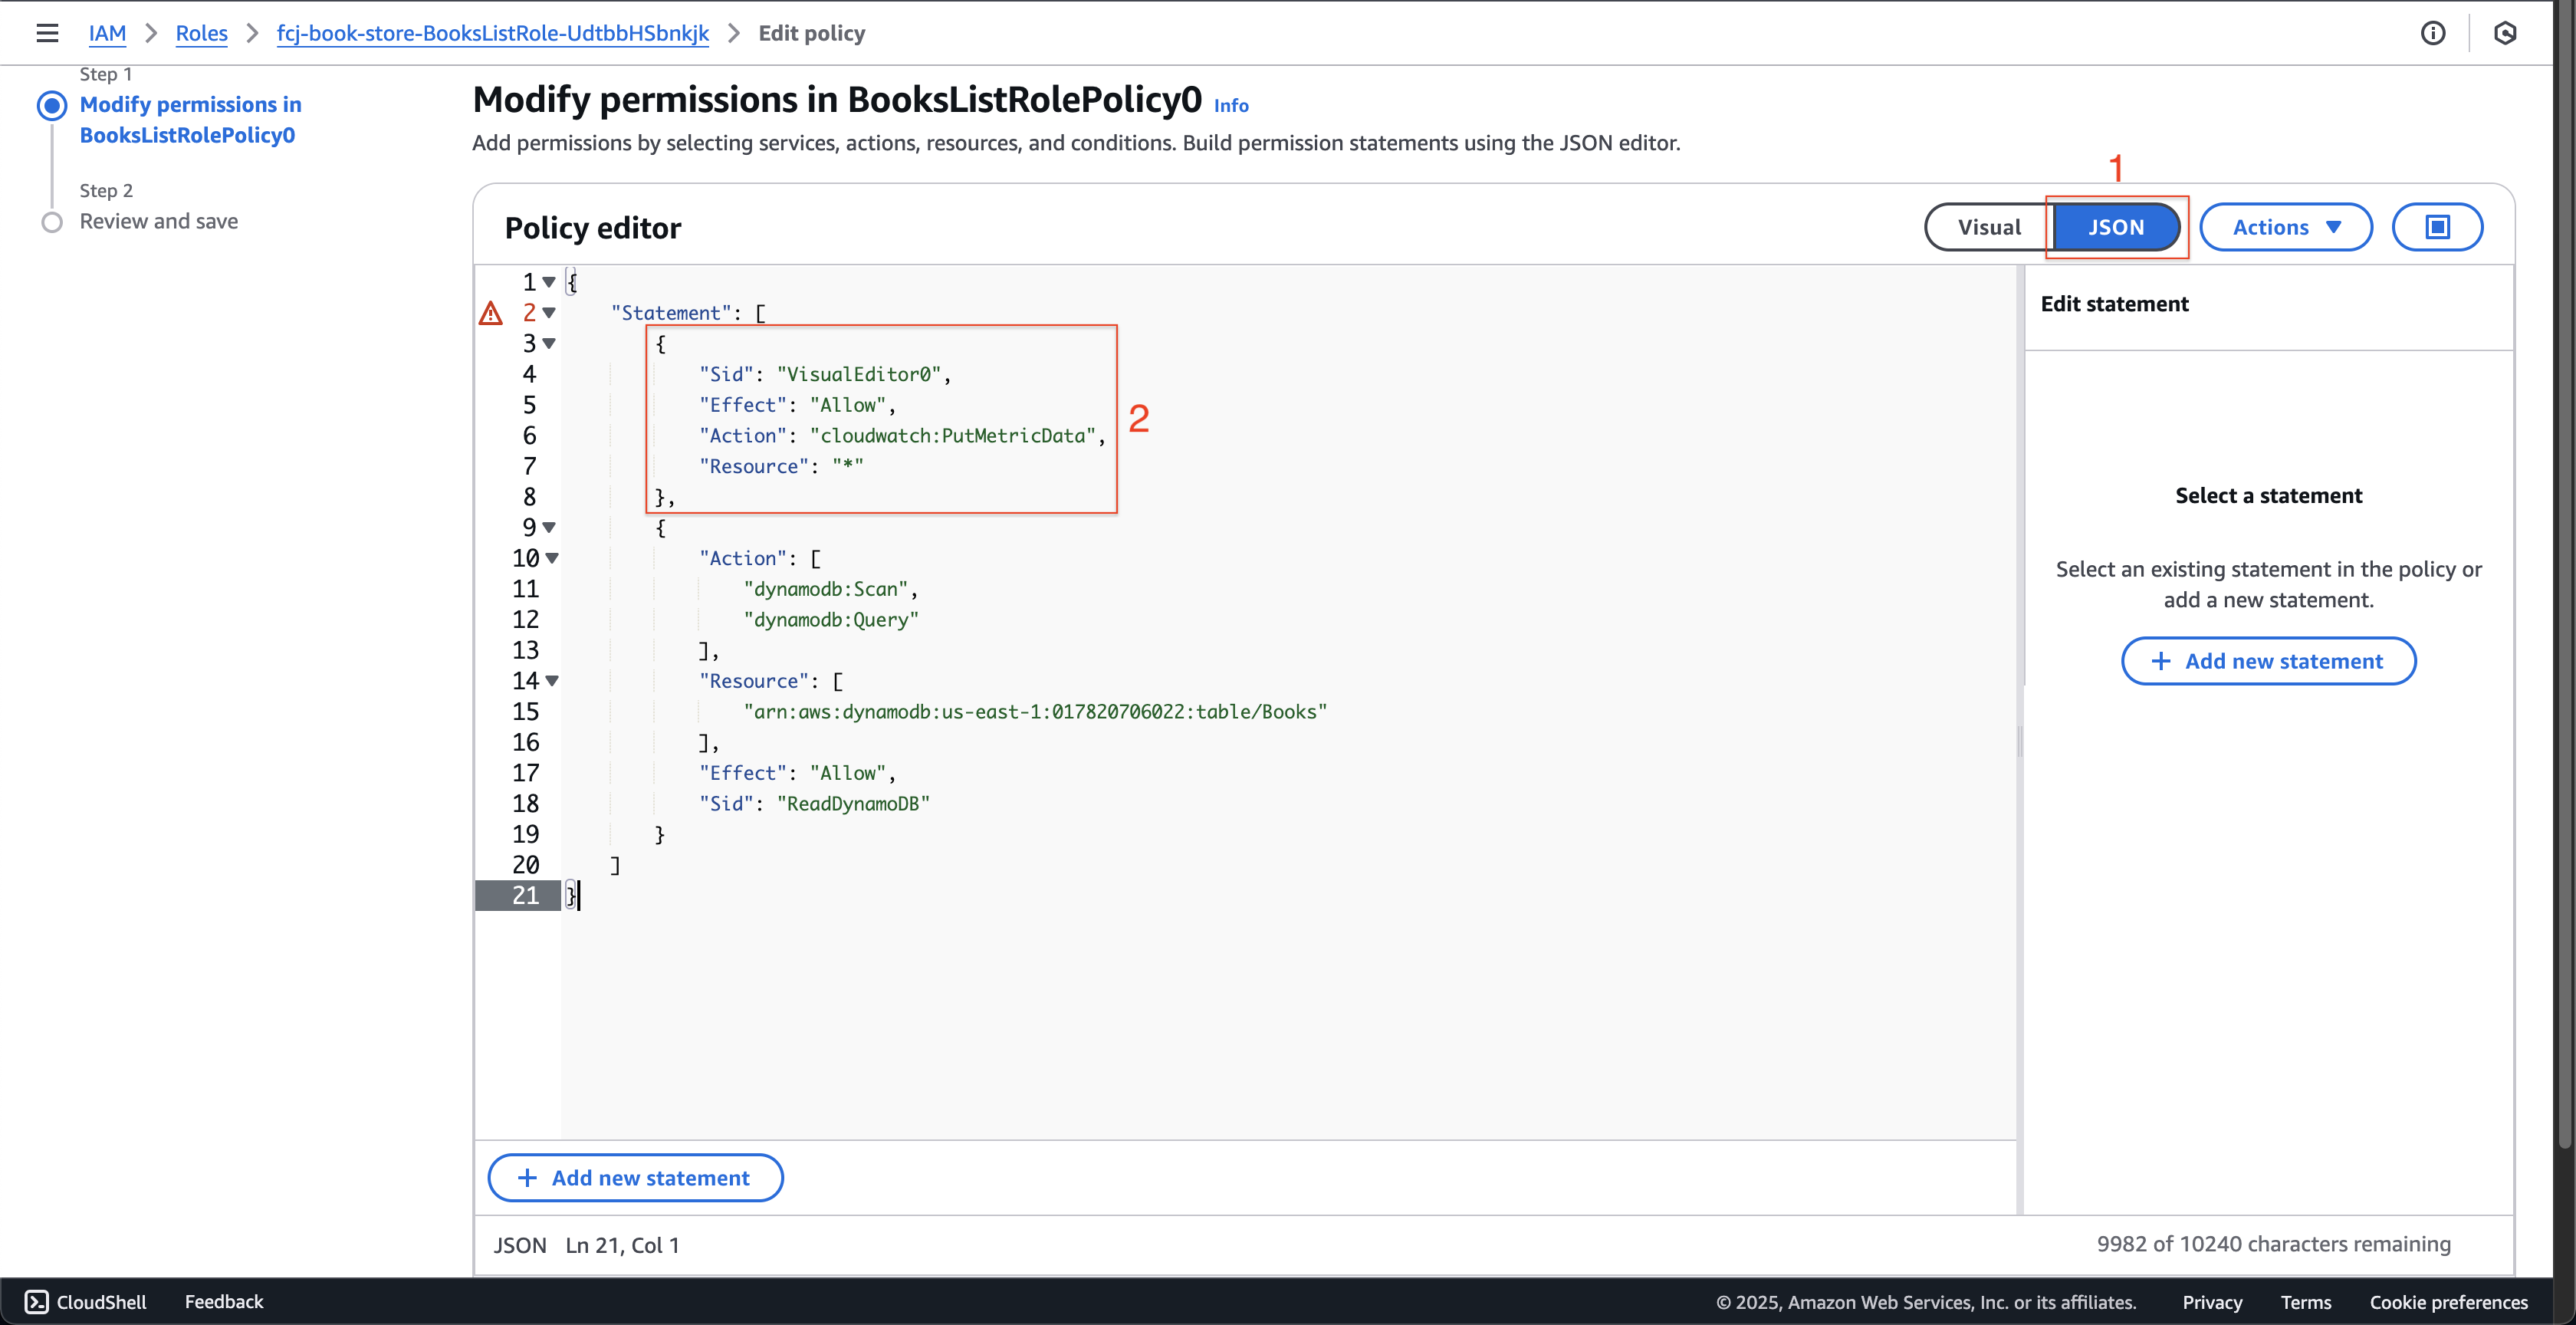
-
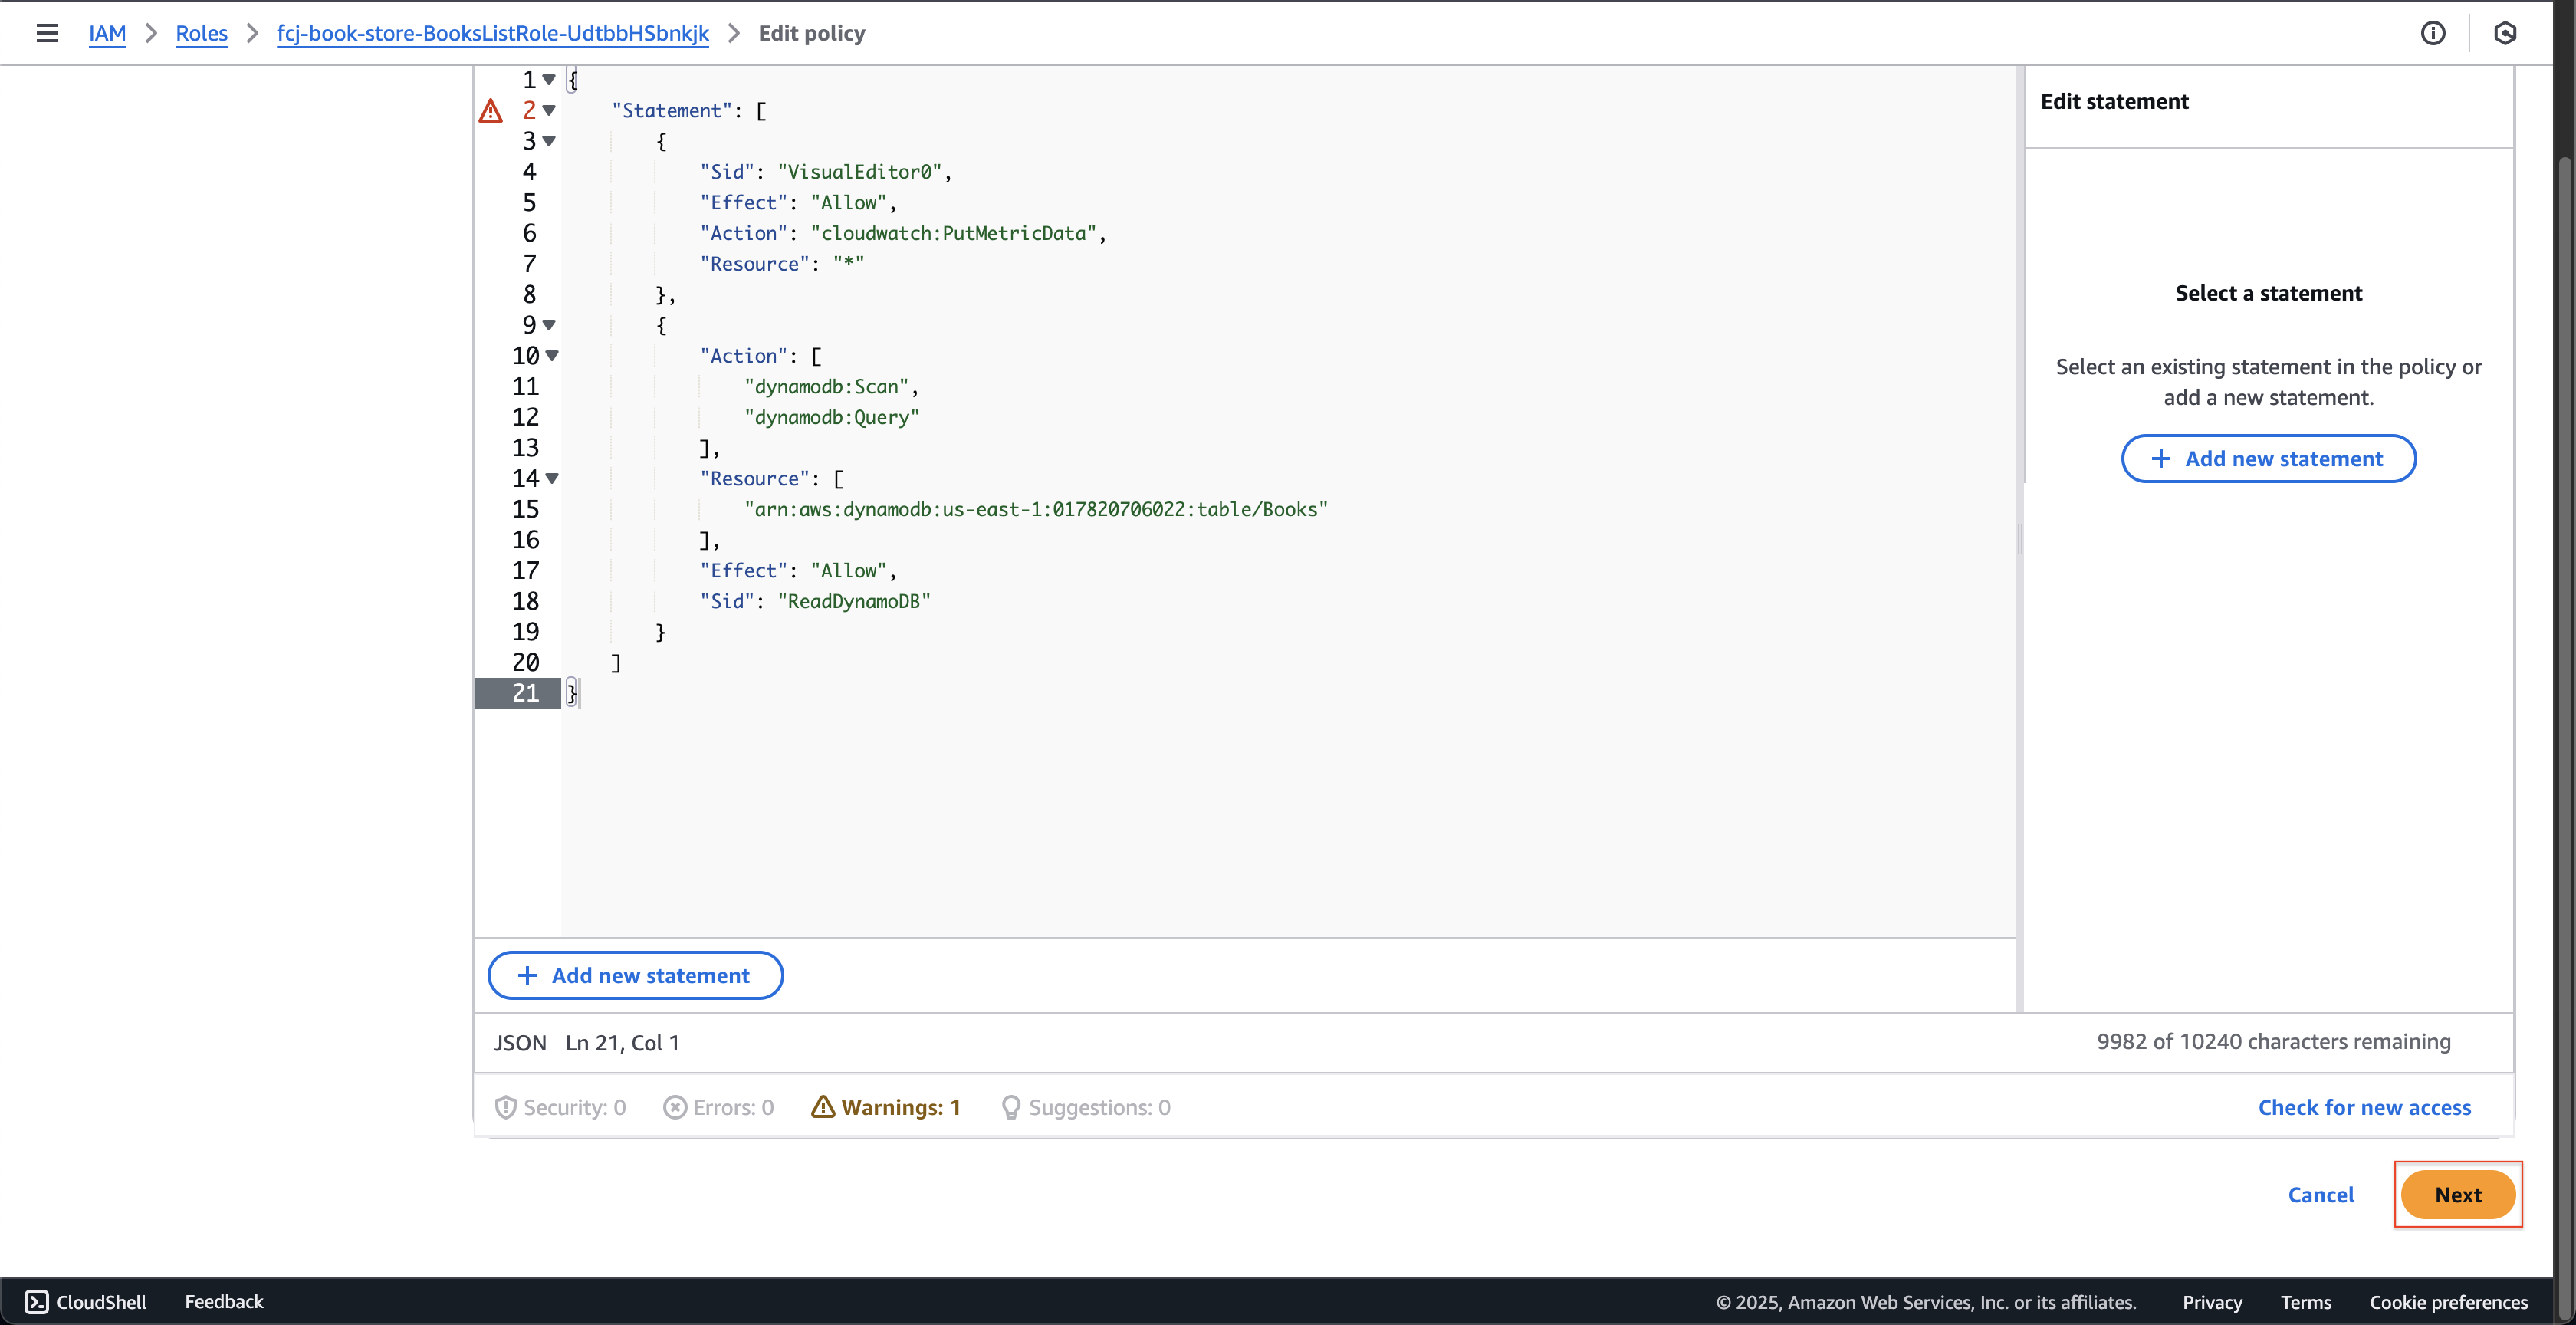
Scroll down to the bottom and click the Next button.
-
-
At Step 2: Review and save page.
- Click the Save changes button.
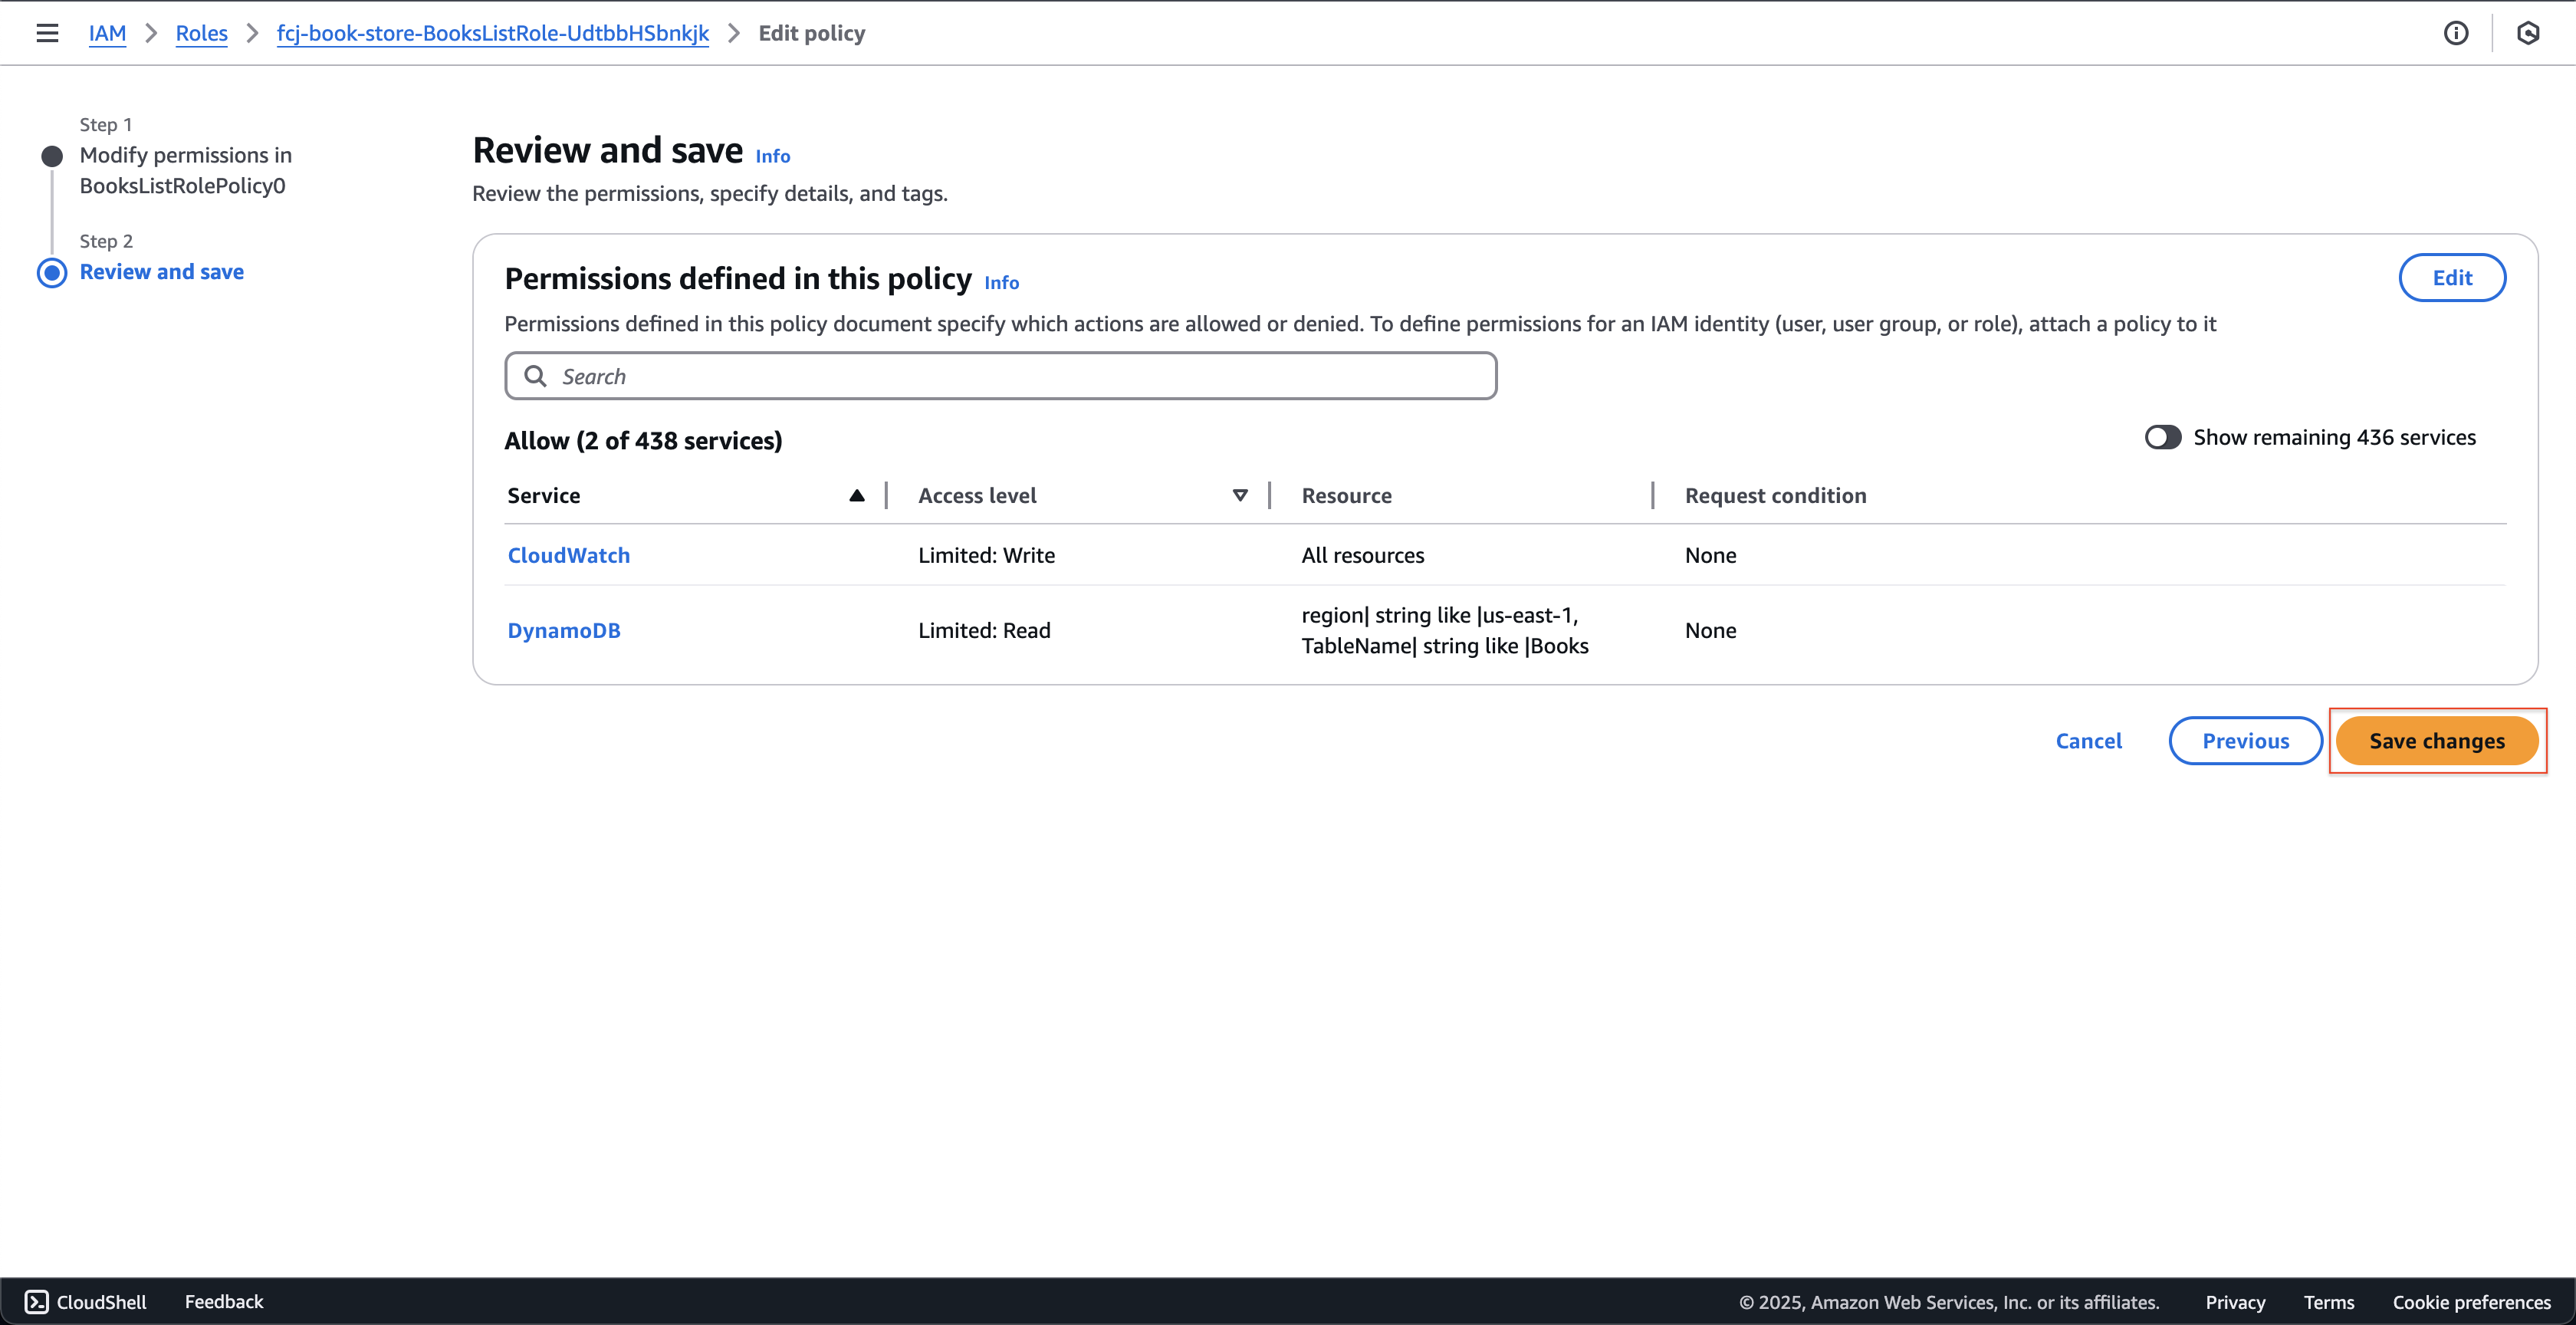
- Click the Save changes button.
-
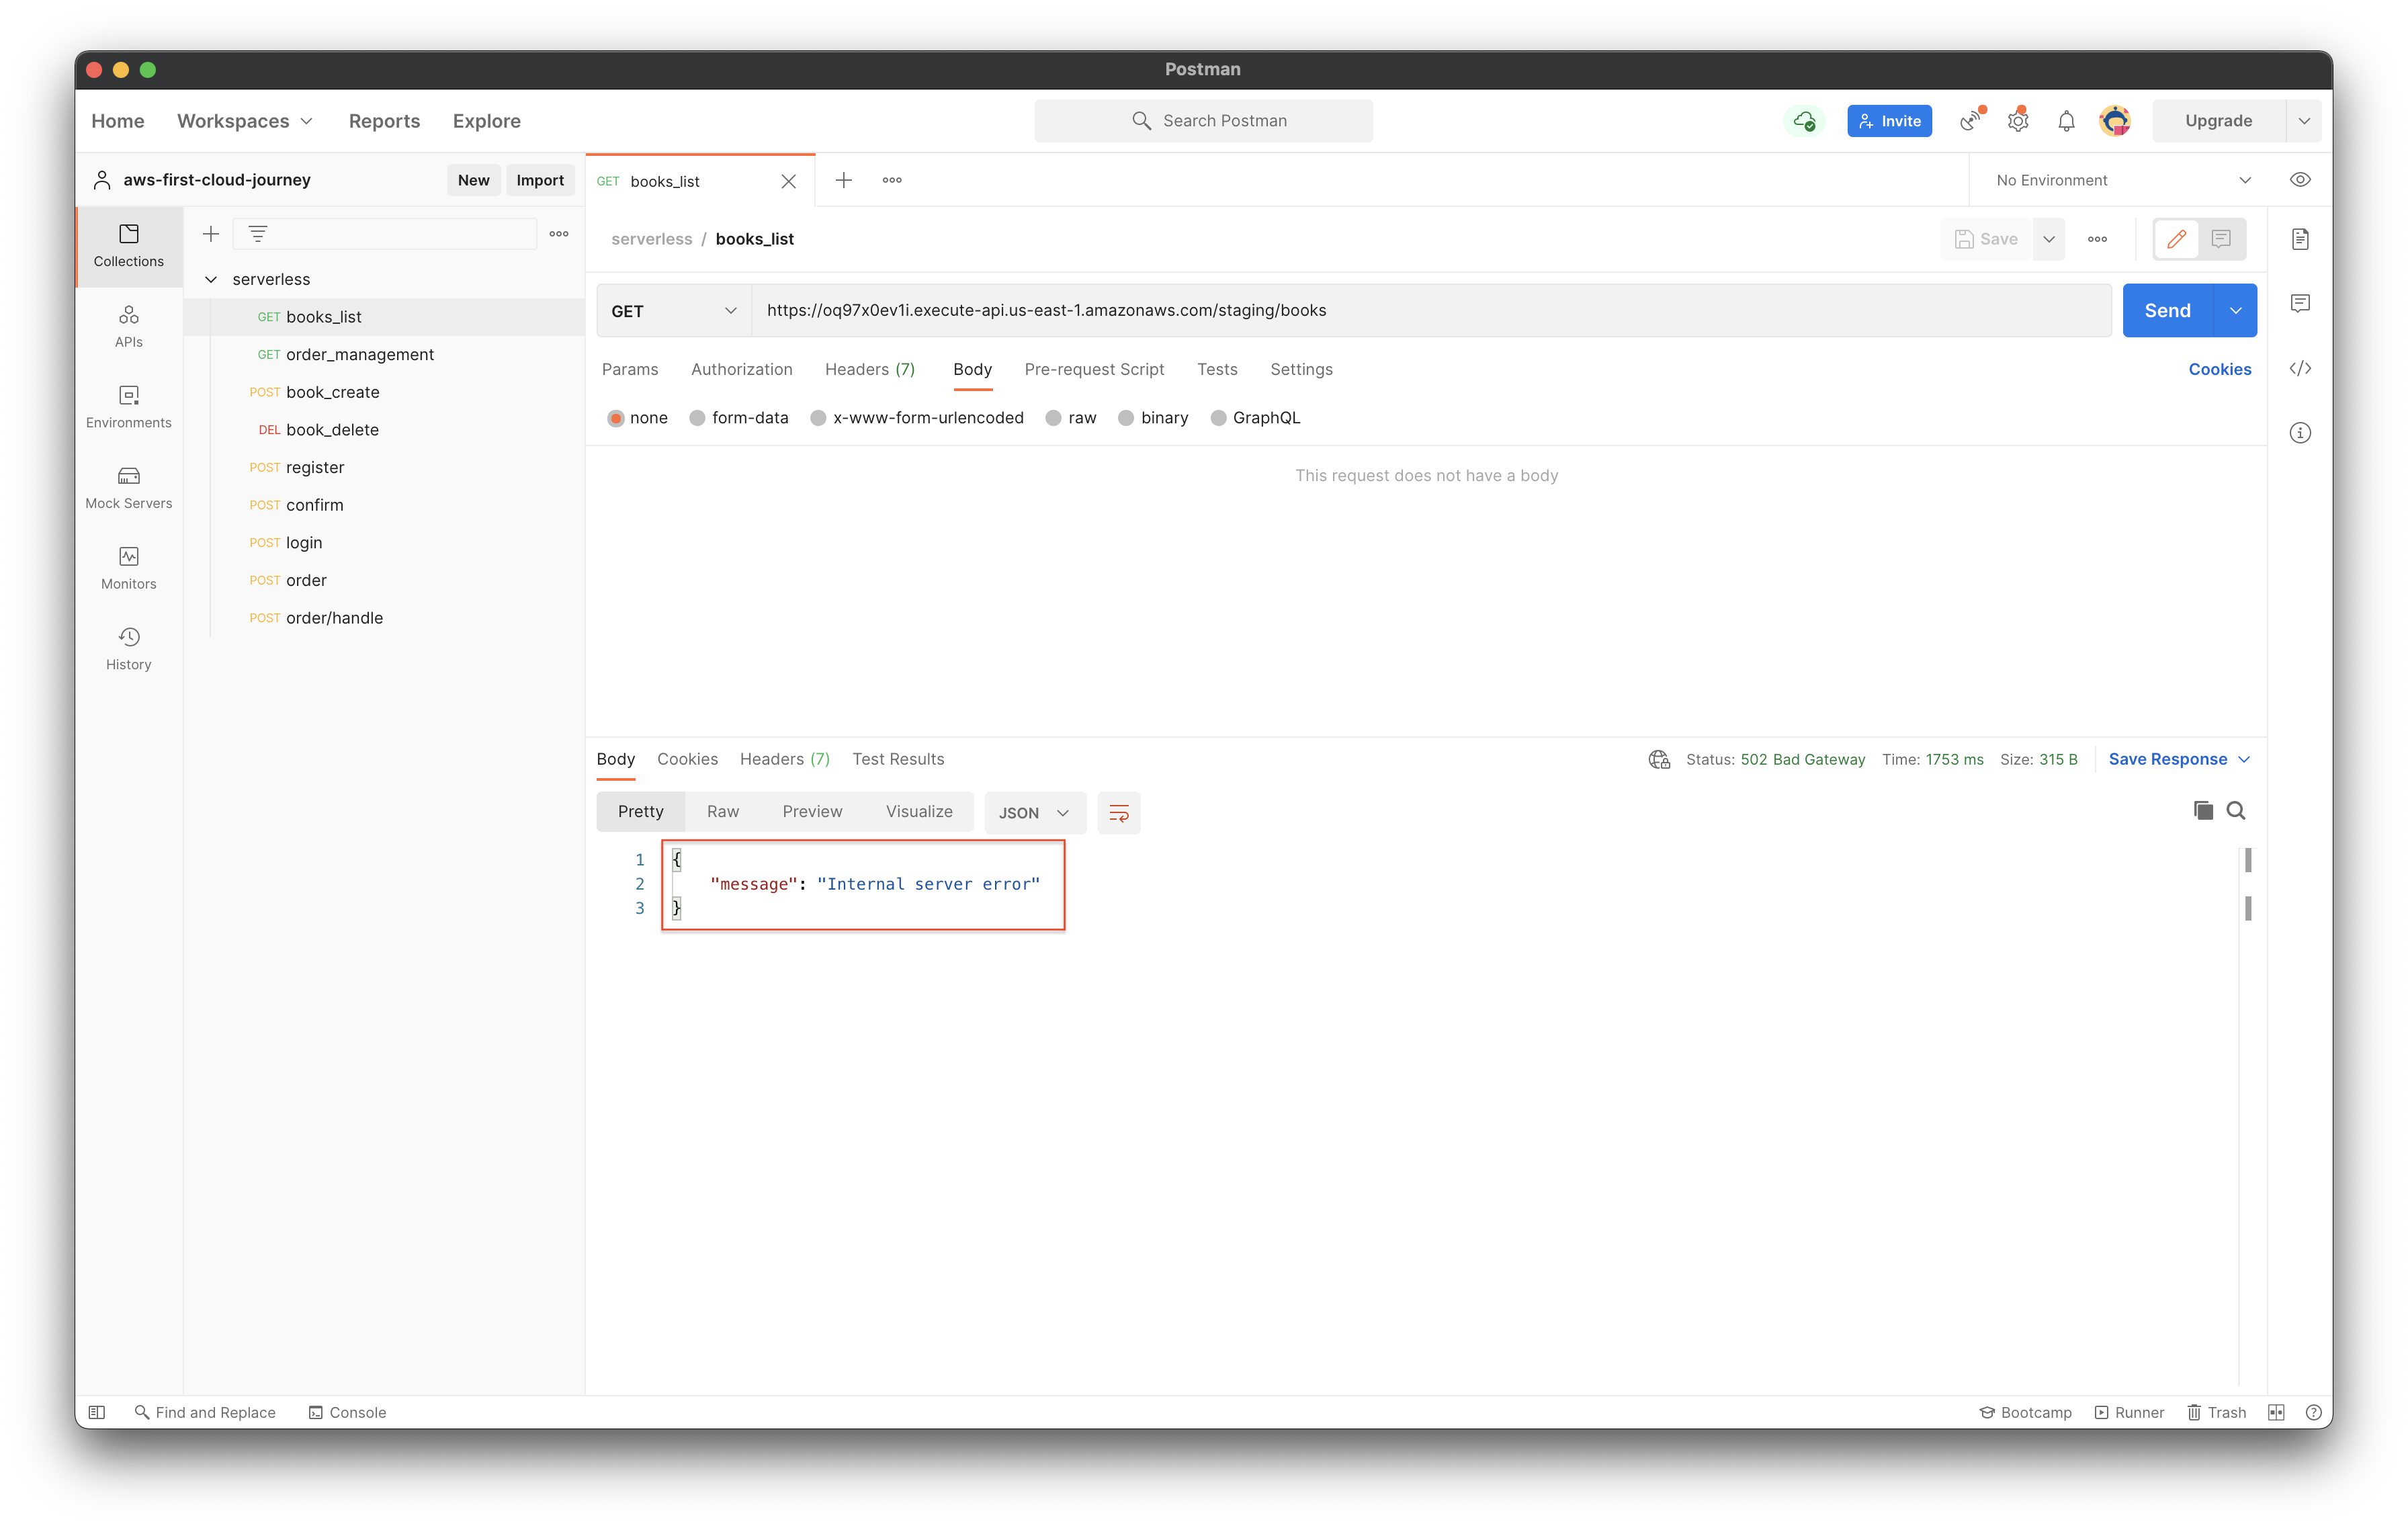
Open Postman to recall the api, the error returned is Internal server error.
-
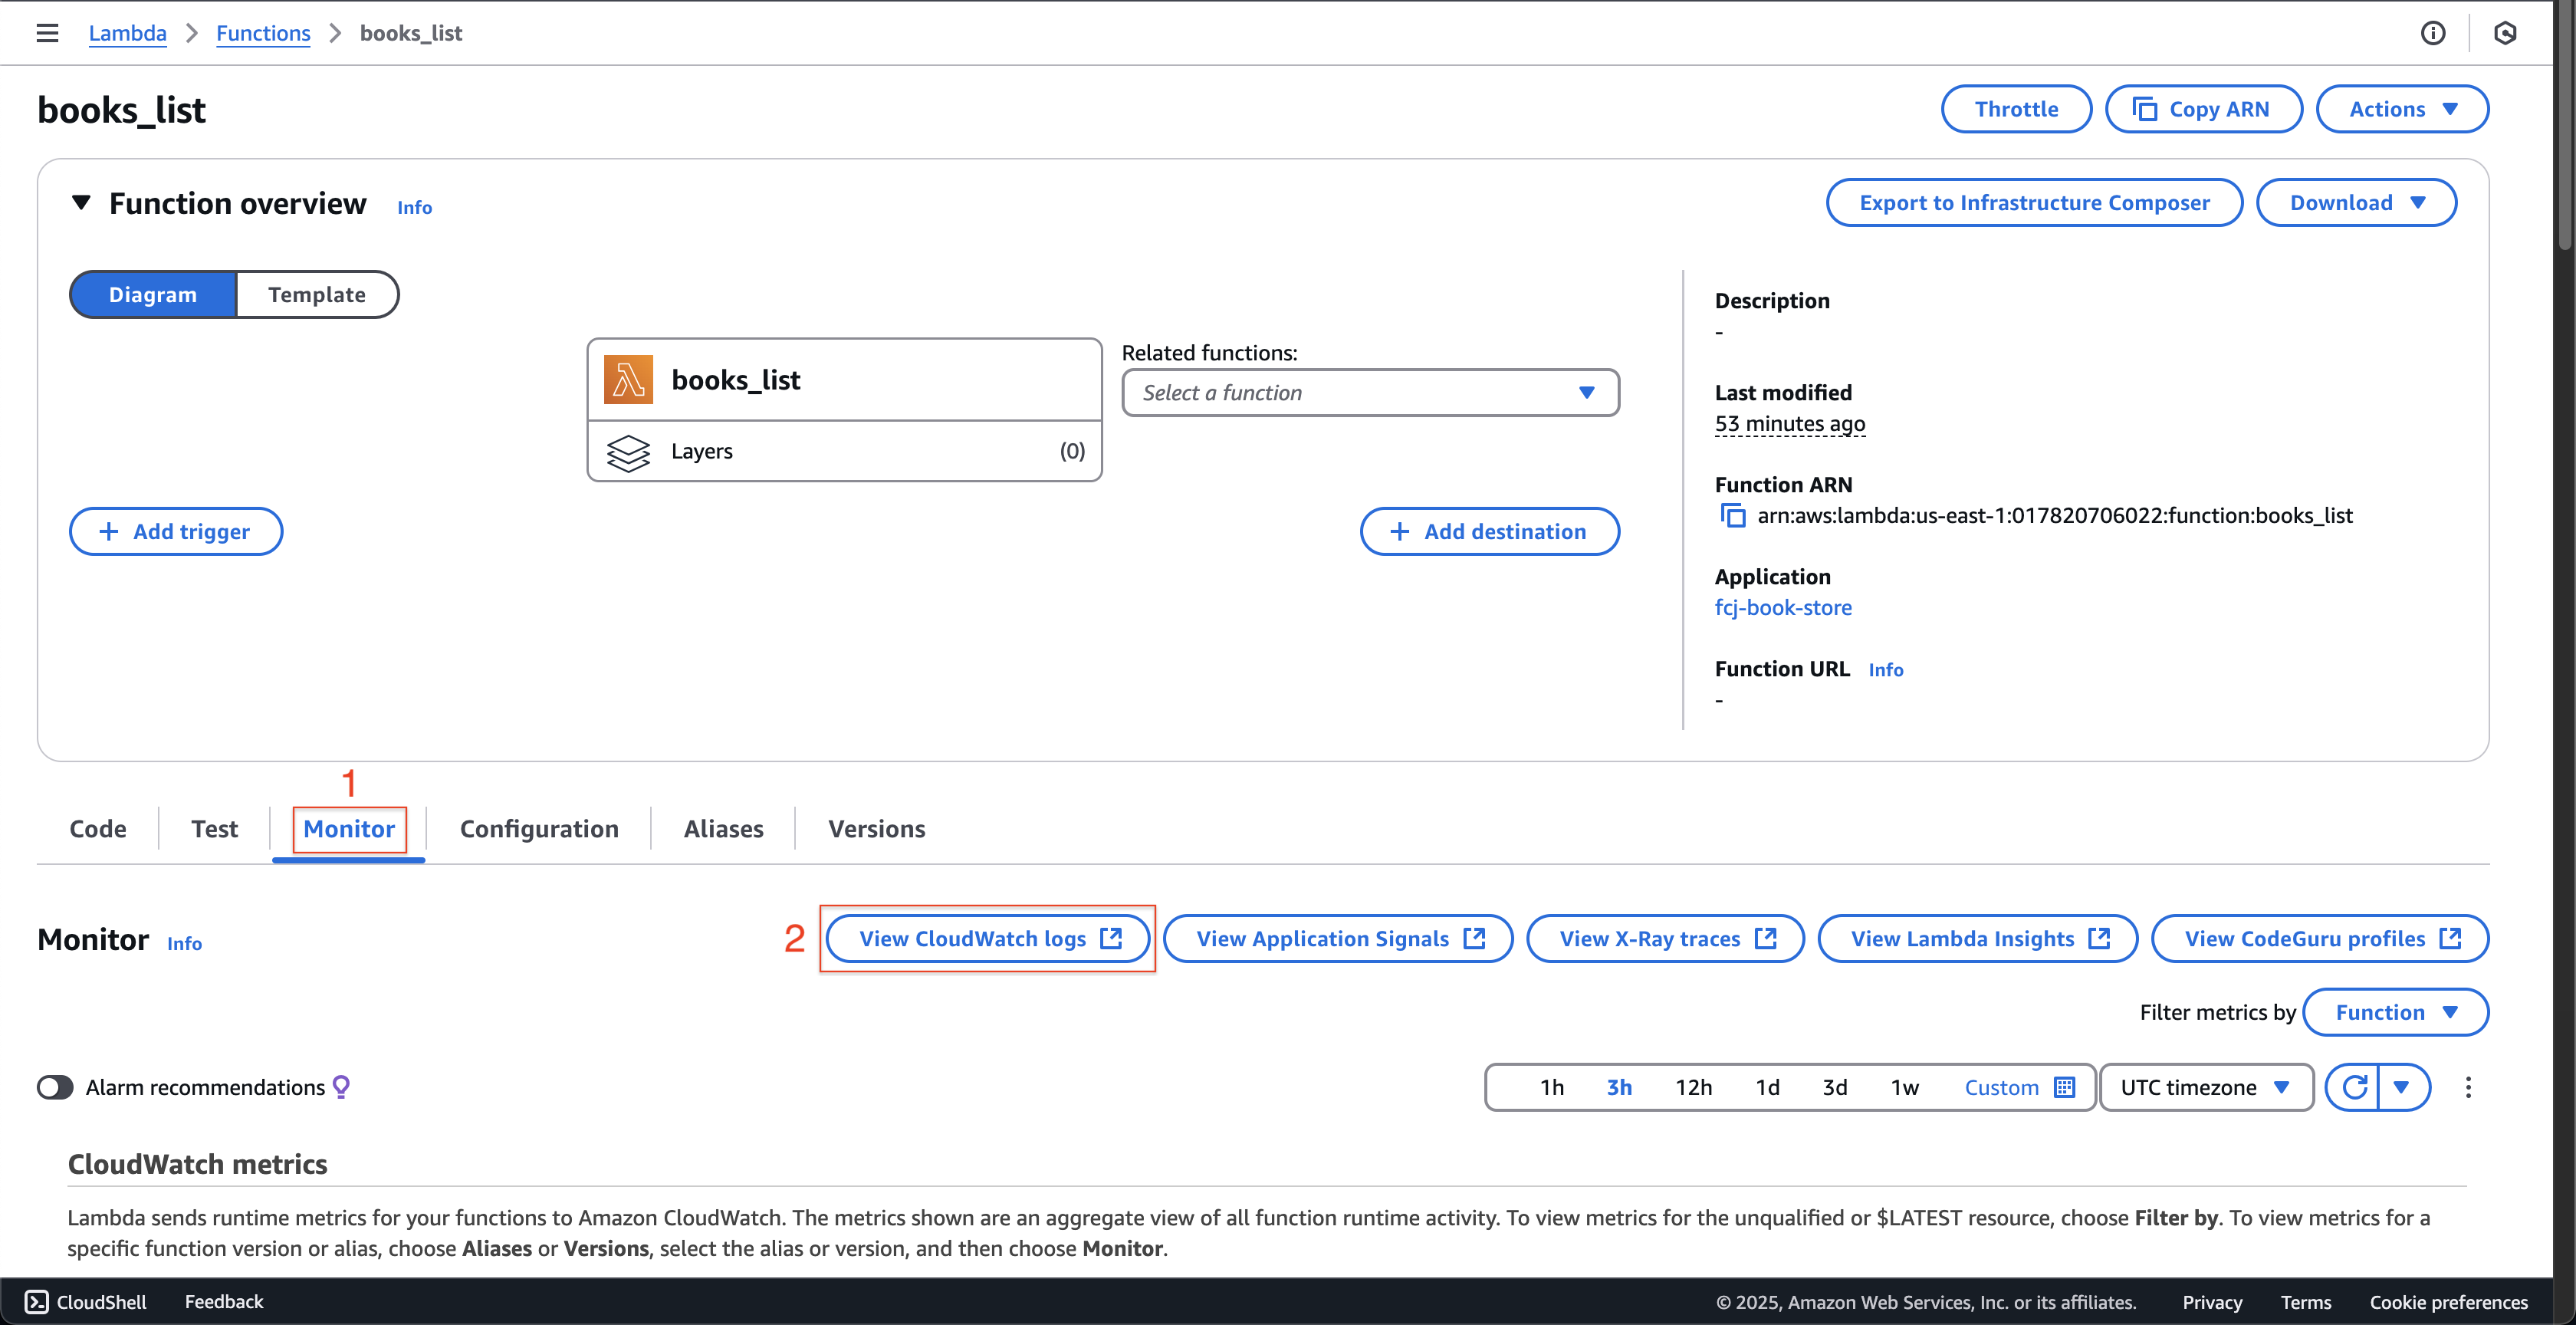
Back to books_list Lambda function page.
- Click the Monitor tab.
- Click the View CloudWatch logs button.
-
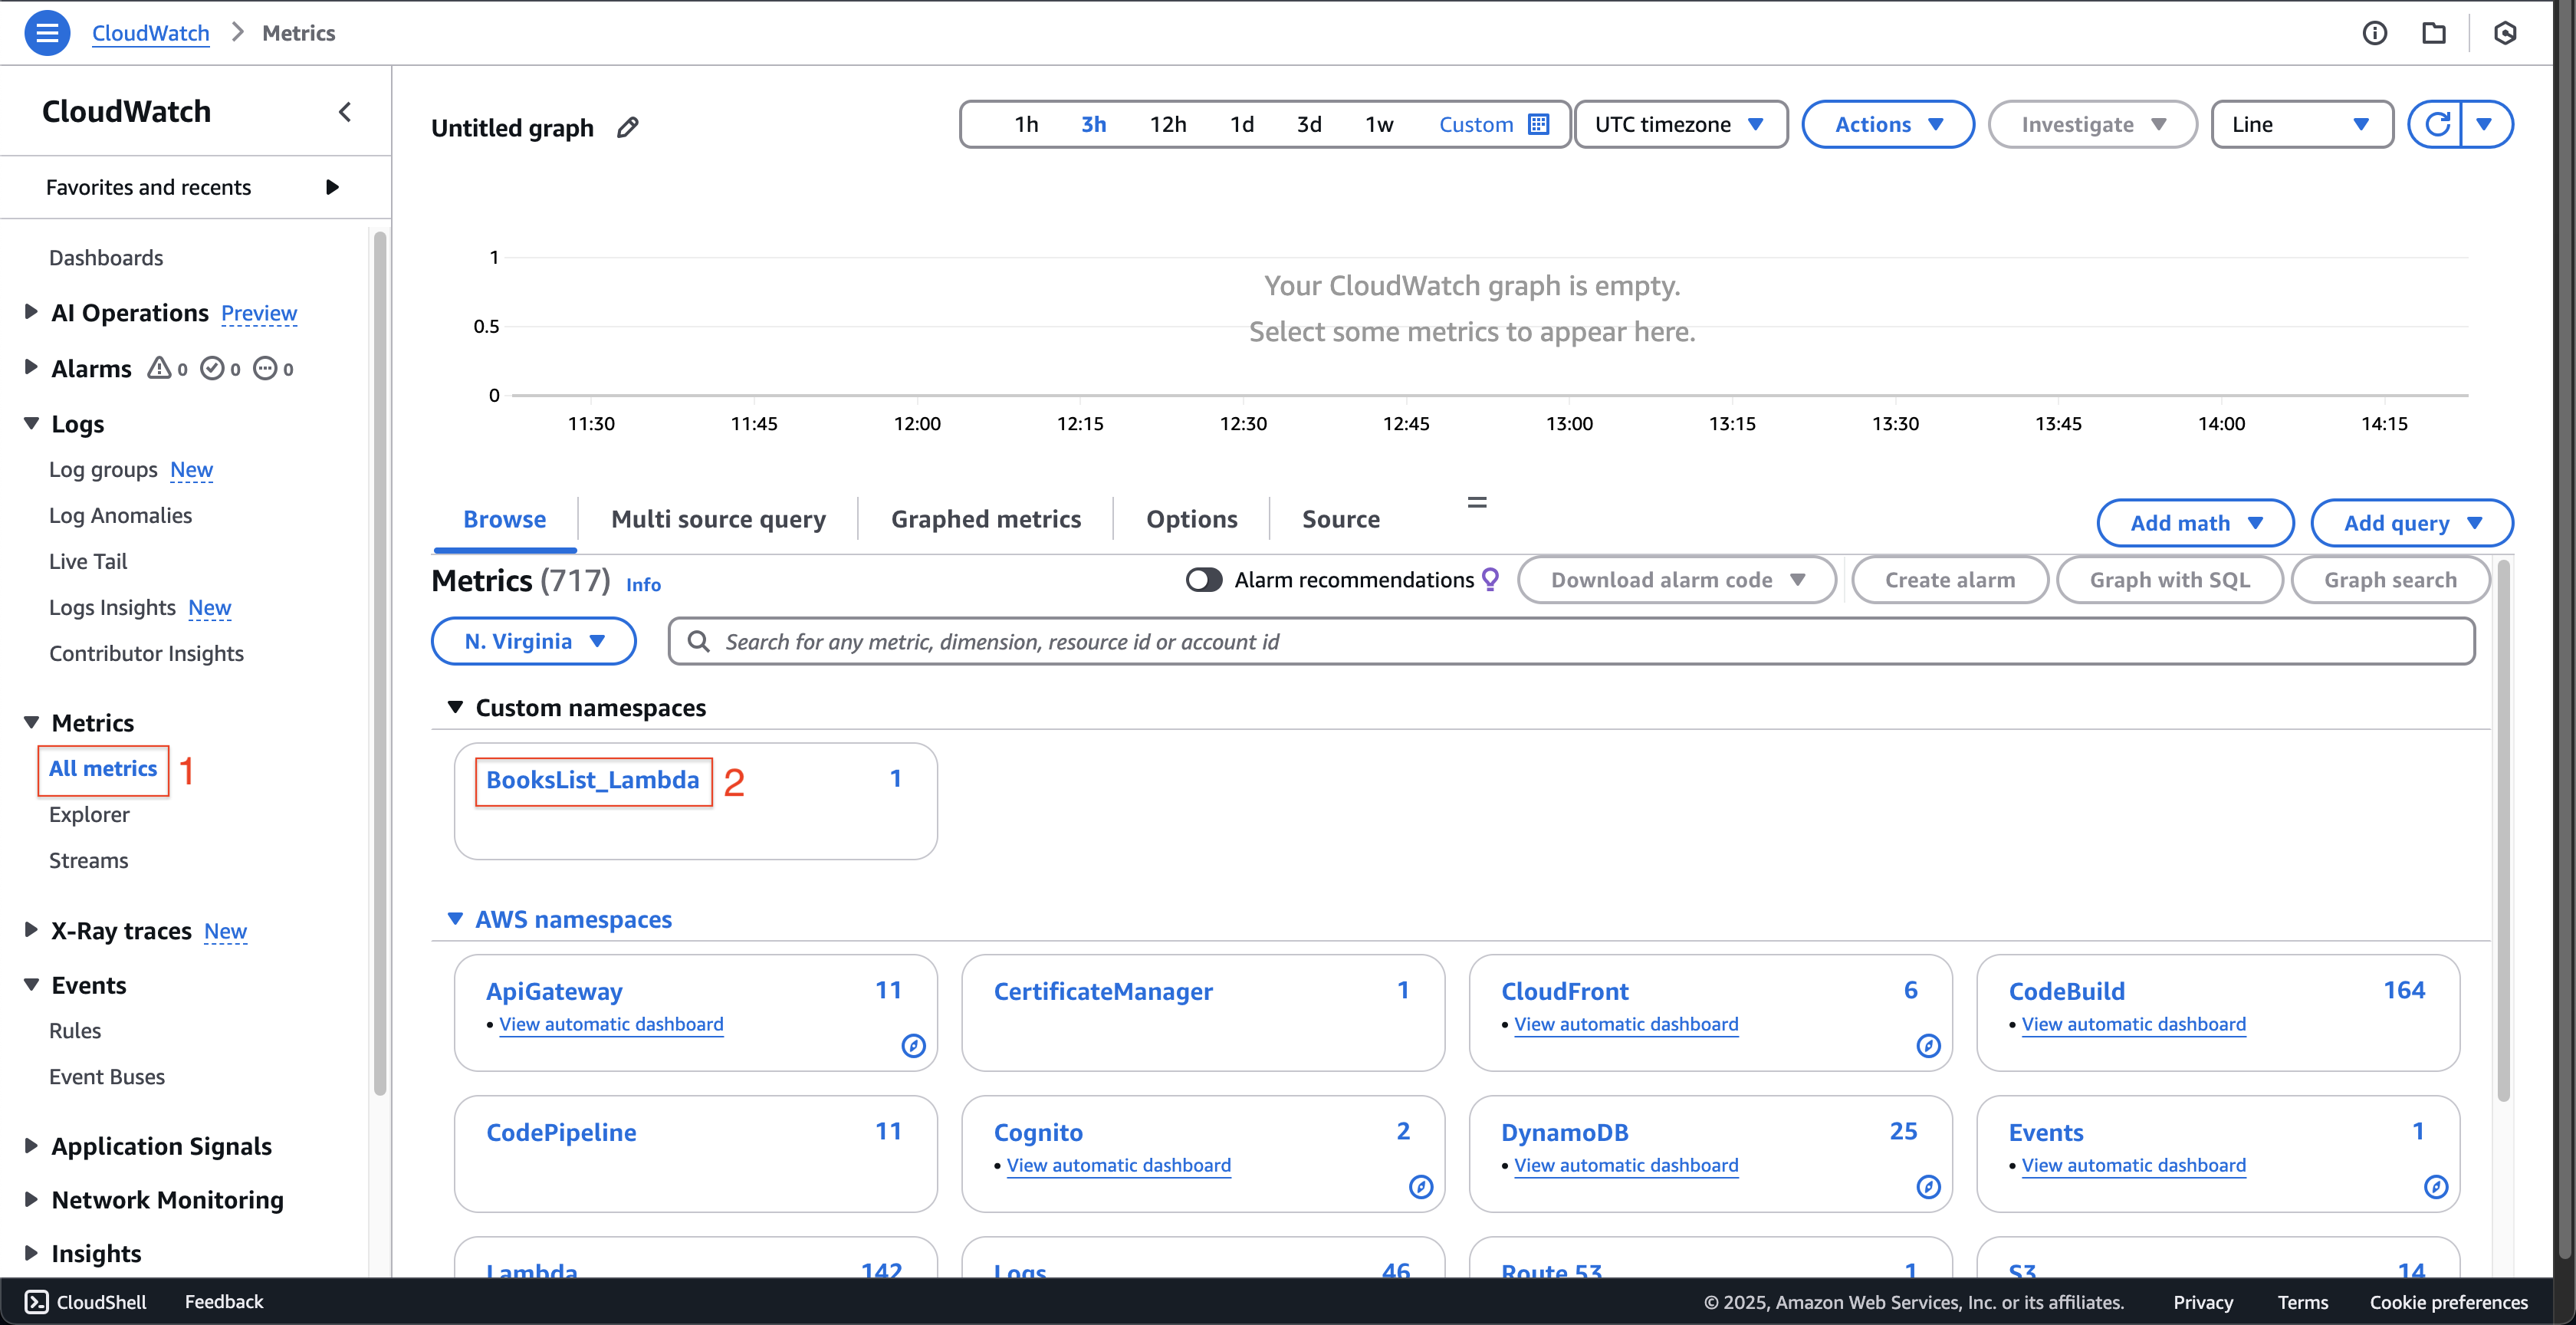
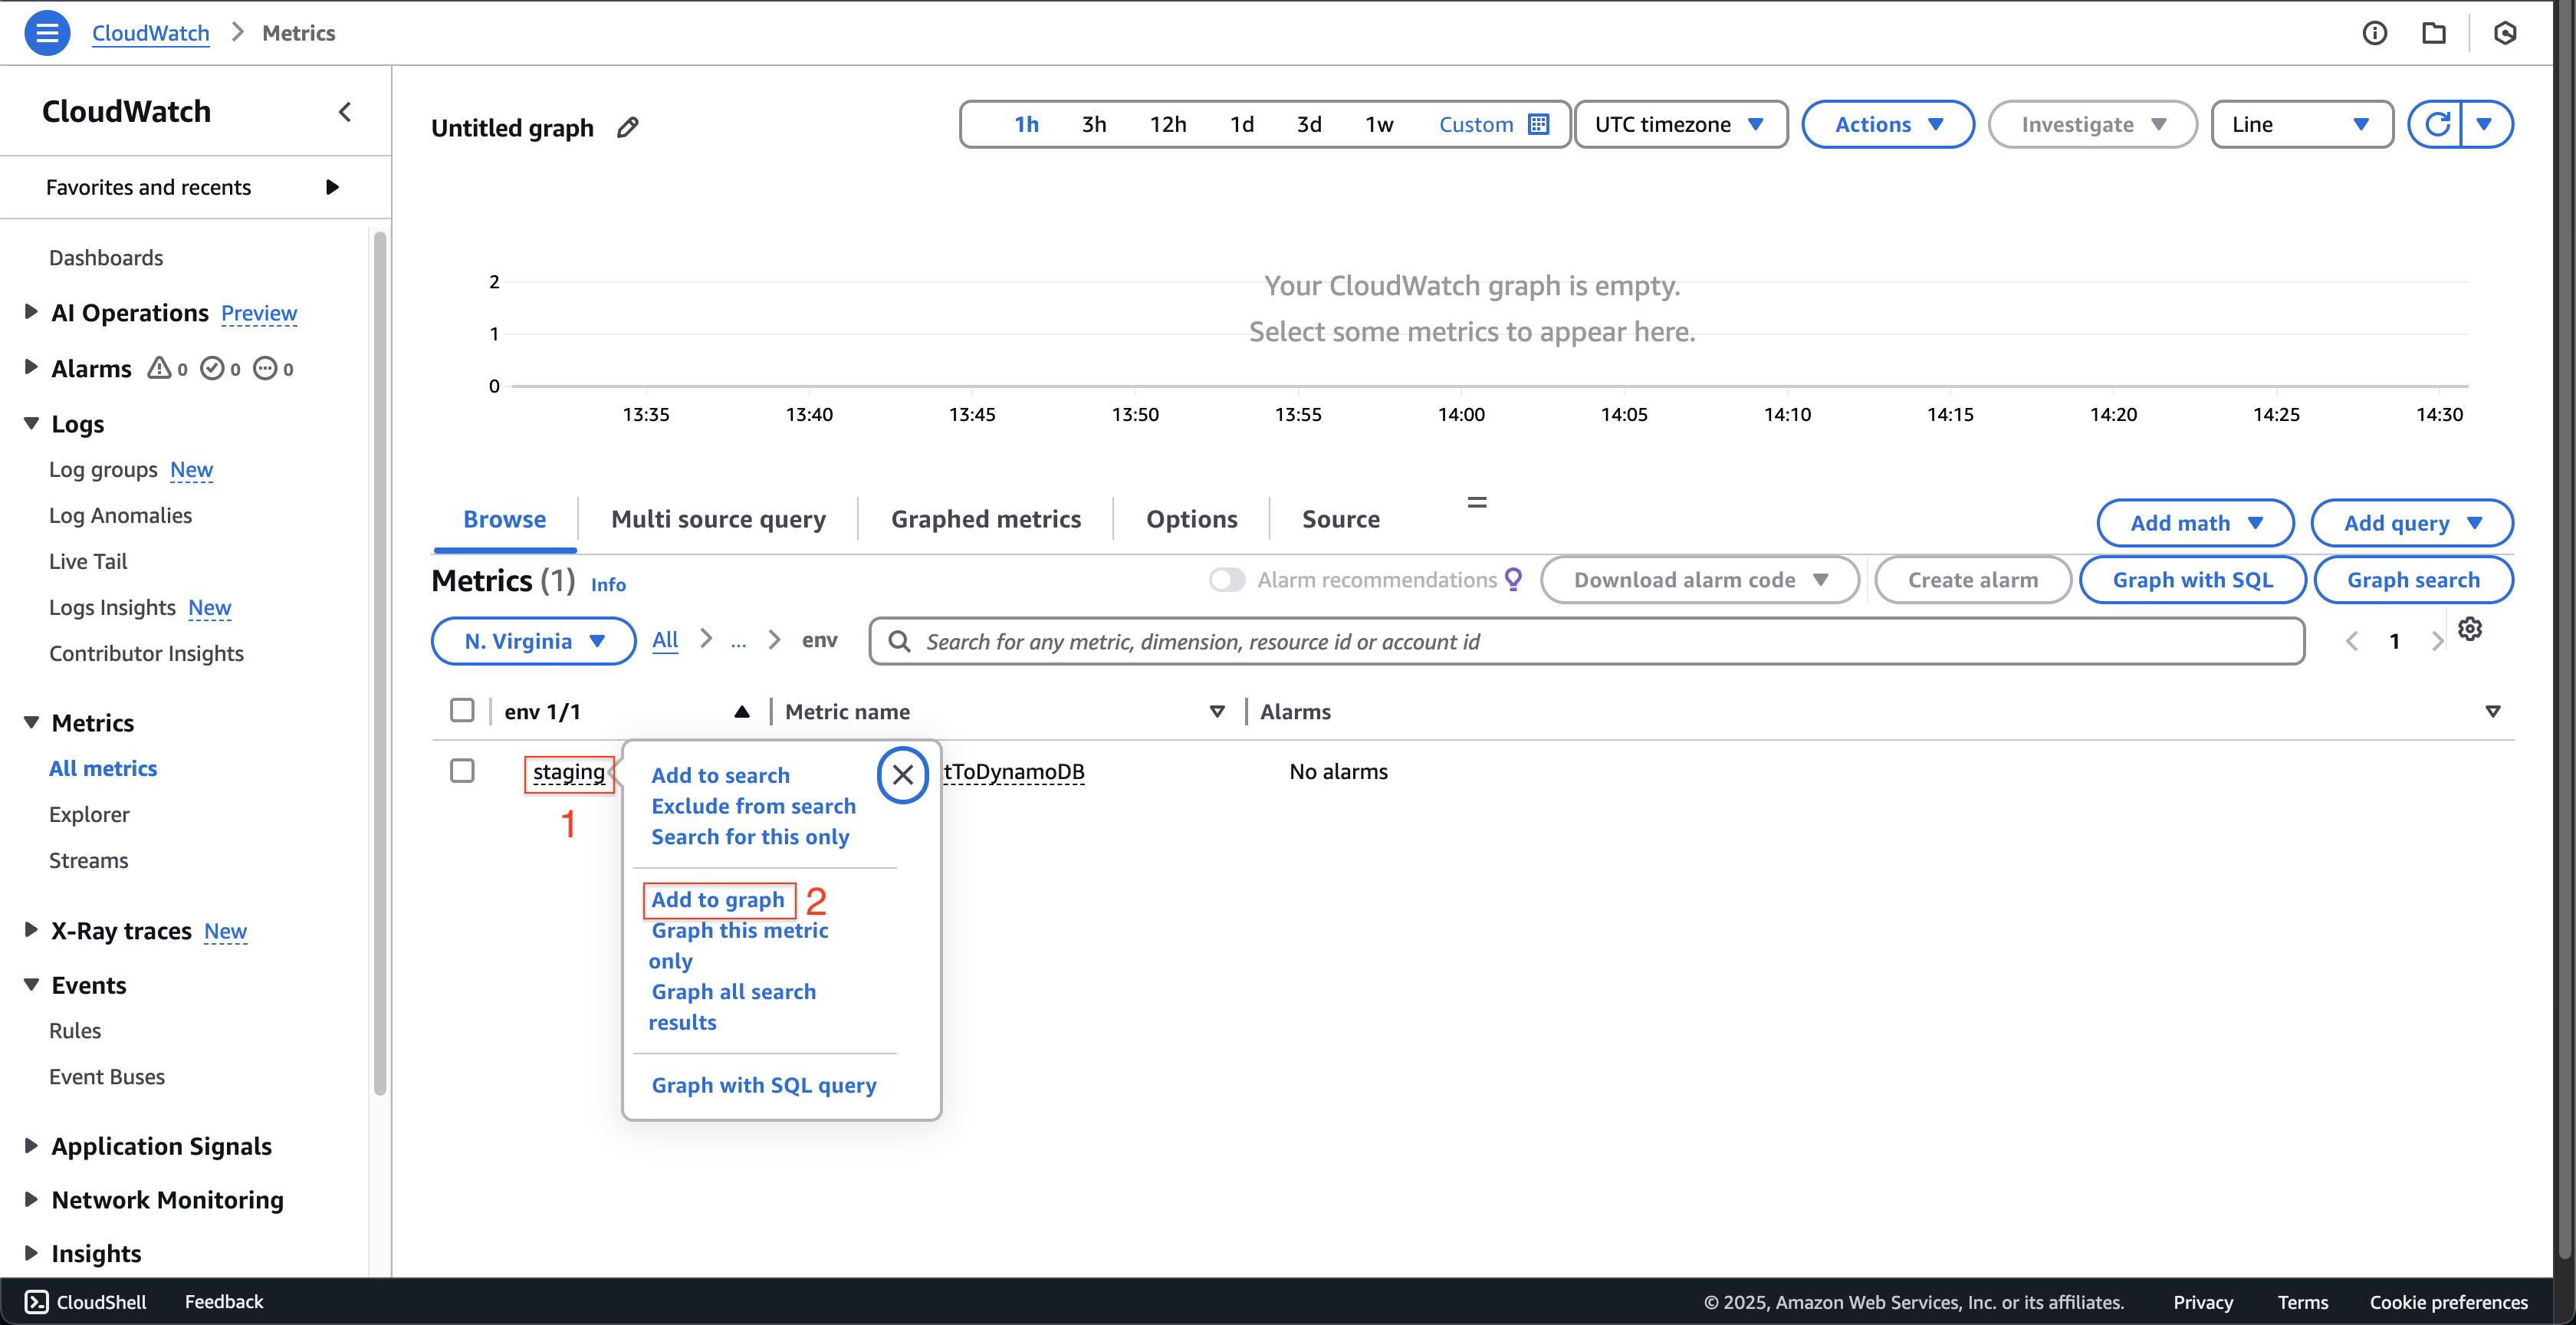
At CloudWatch page.
- Click the All metrics on the left menu.
- Click the BooksList_Lambda at the Custom namespaces.
- Next, click the env.
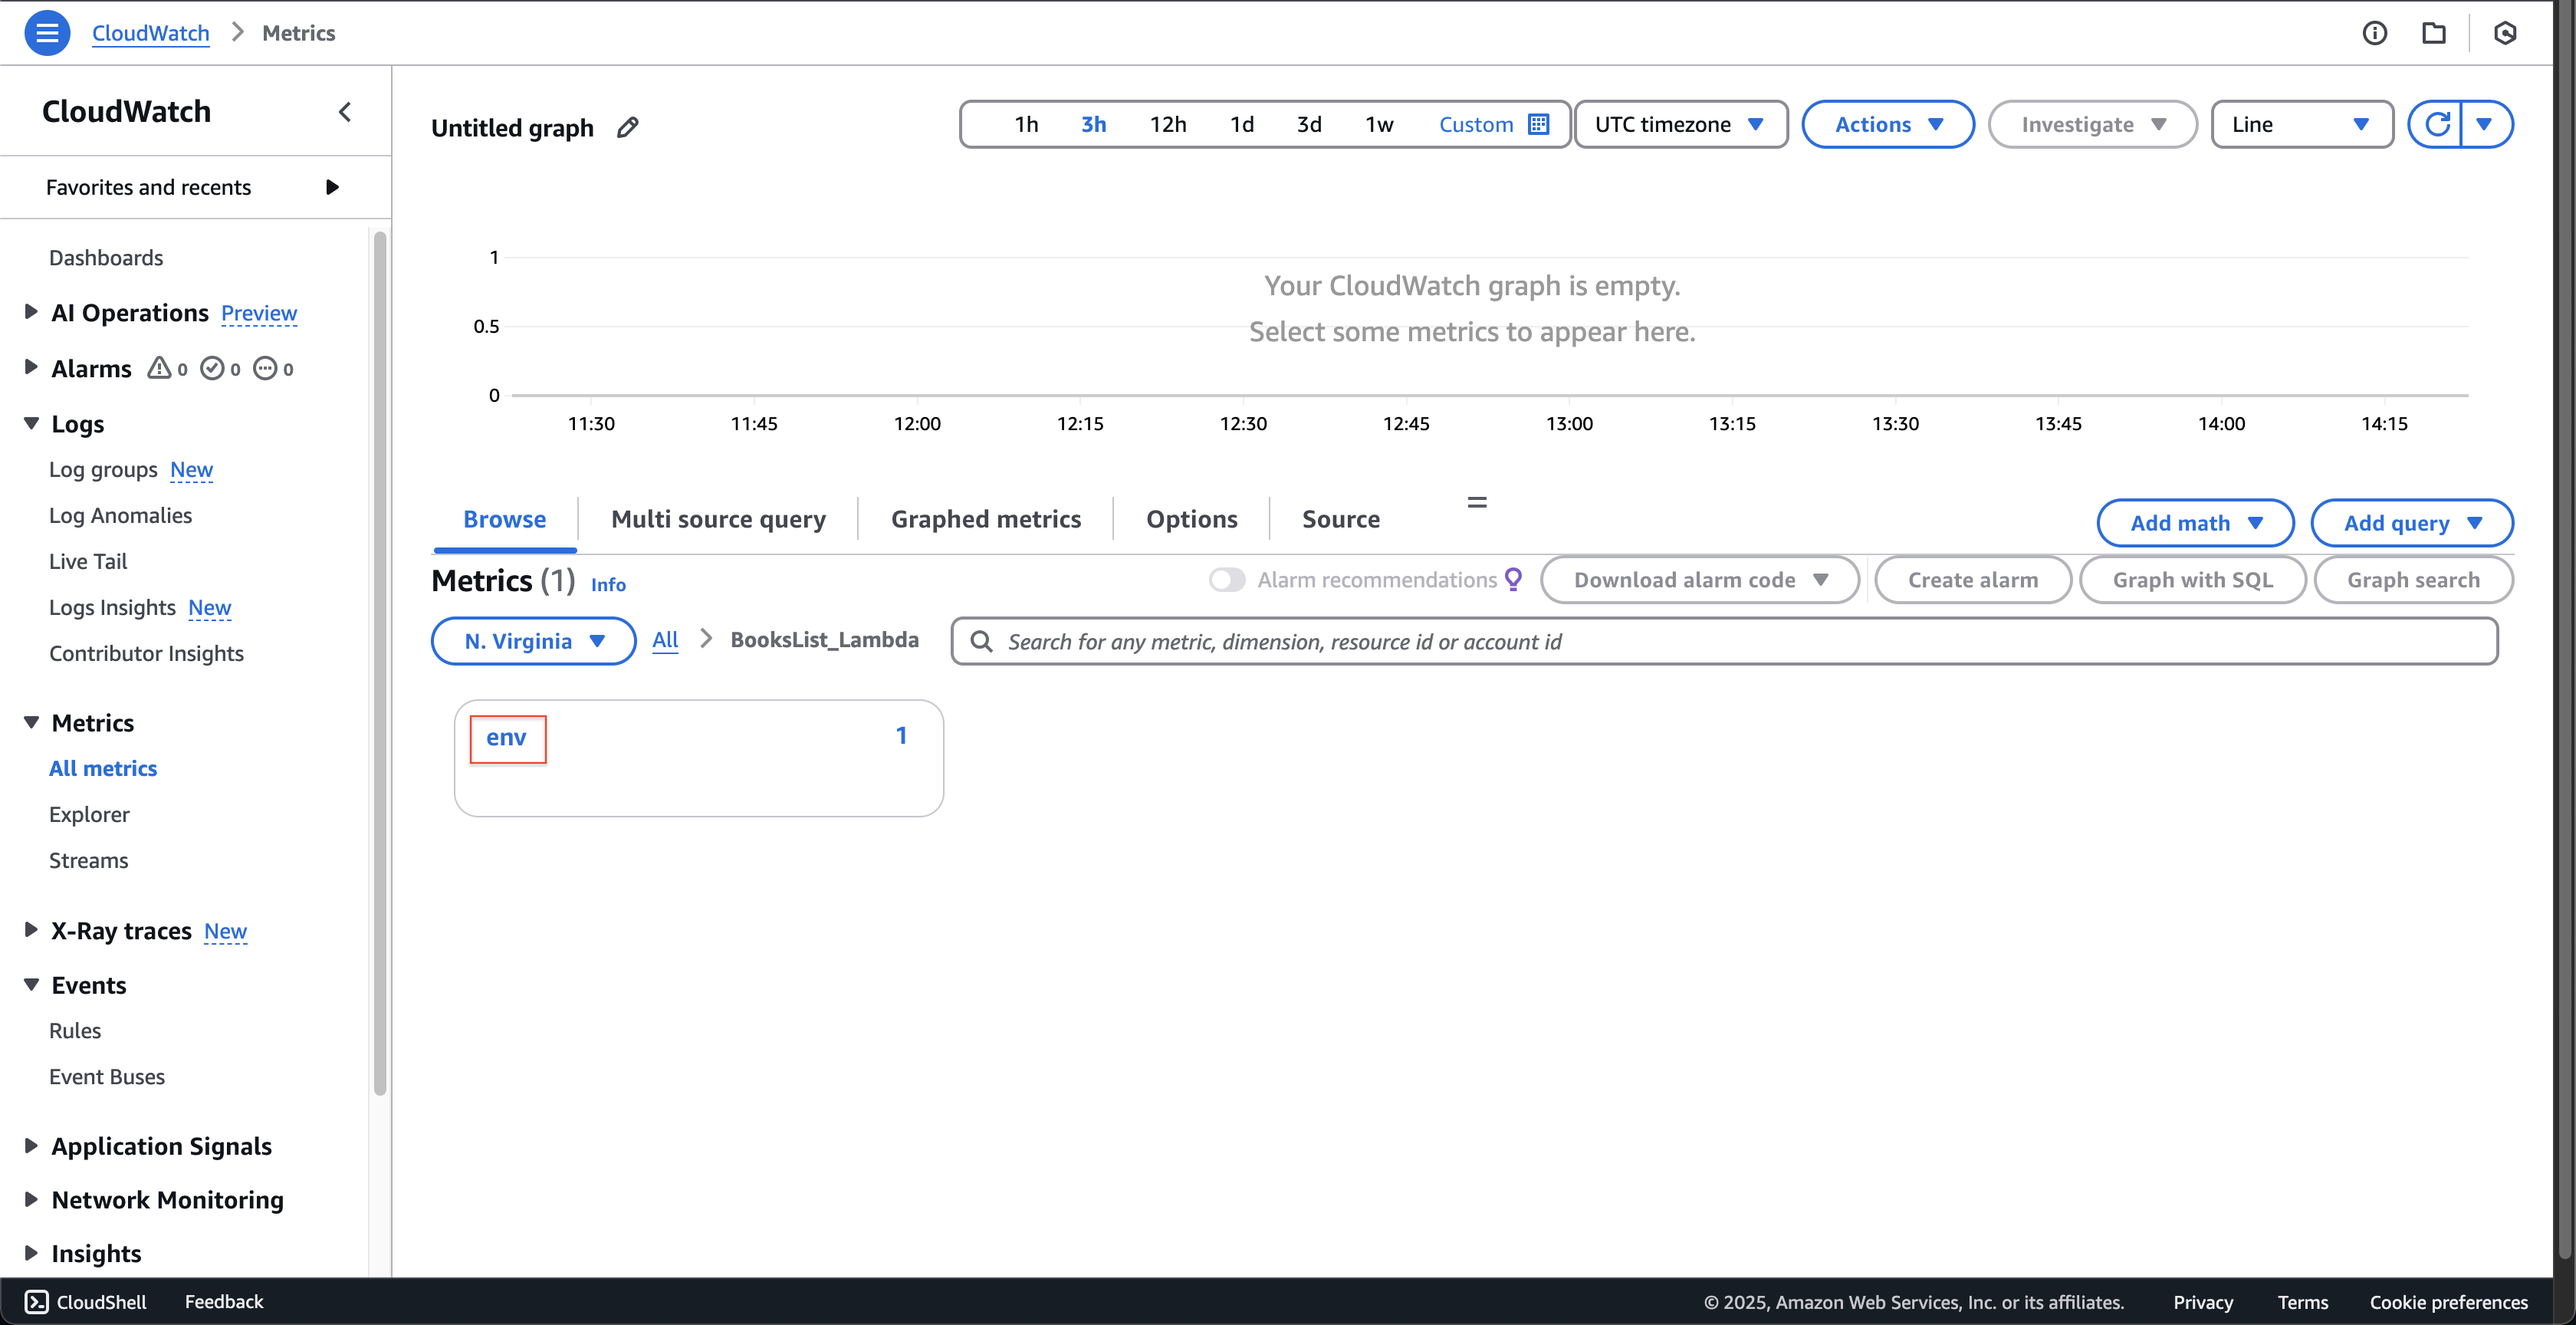
- Click the staging.
- Click the Add to graph.
- After the graph is refreshed, hover the Blue point on the graph.
- Then, you can see the information.
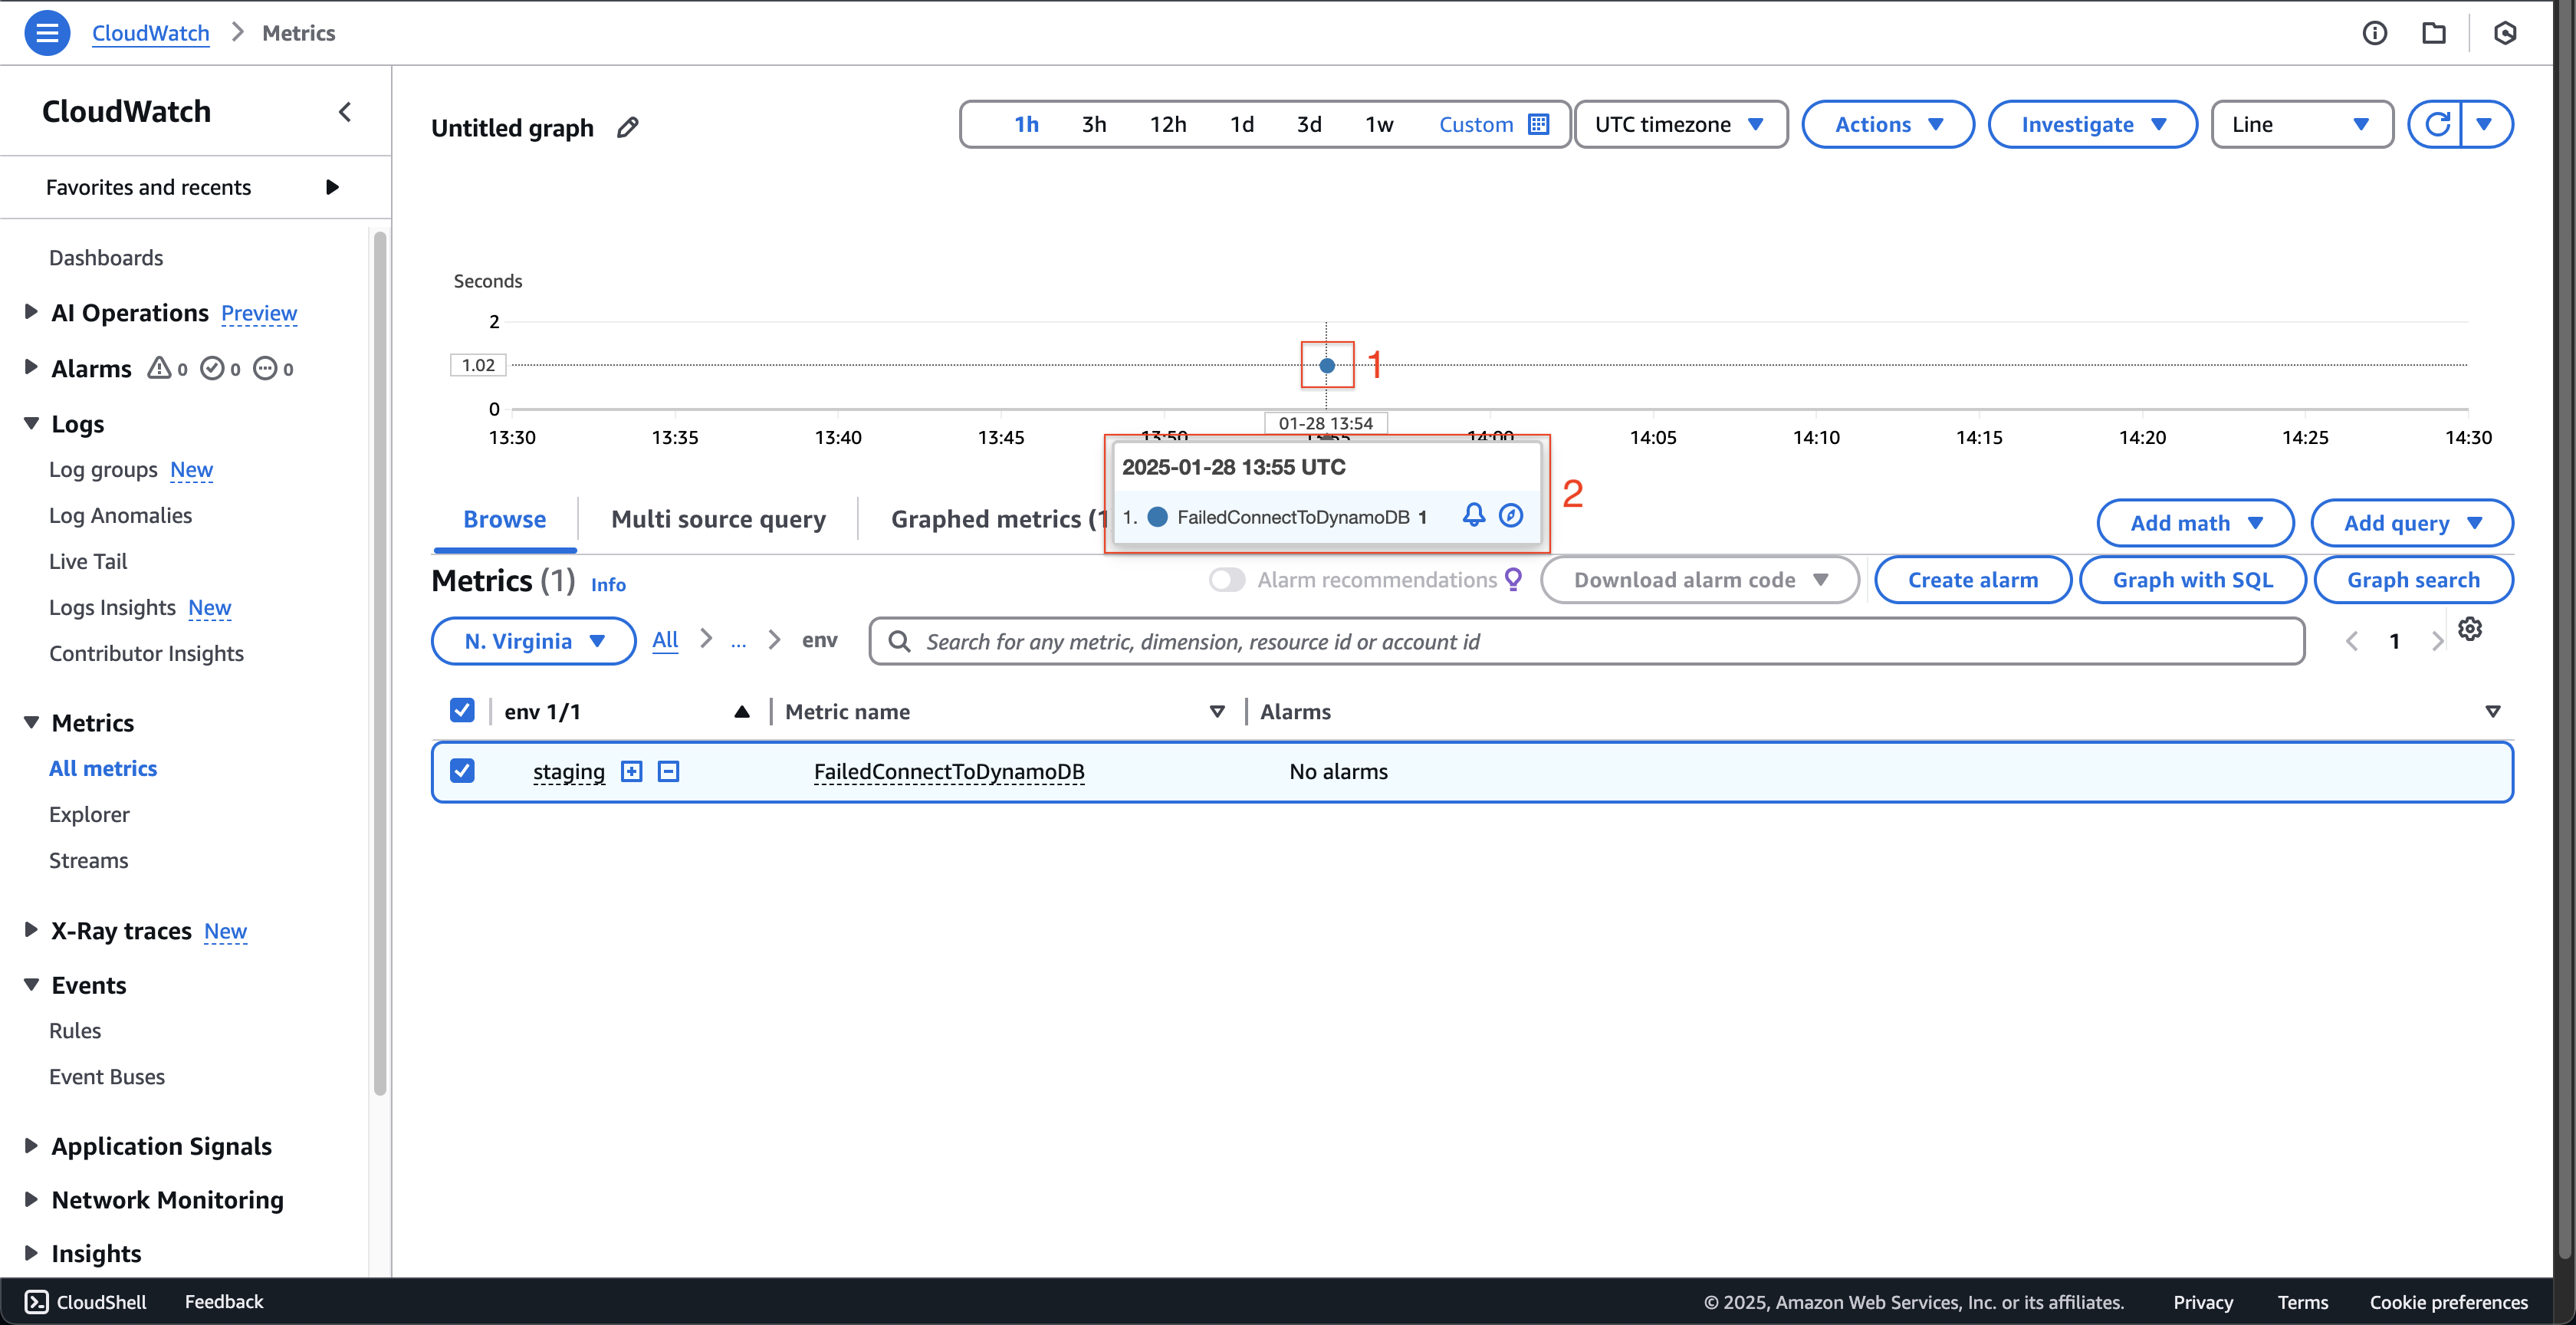
So we created a custom metric successfully. Next step we will use it to create a CloudWatch Alarm.